Is it possible to position ticklabels on negative $y$ axis on its right side? Ticklabels on positive $y$ axis should remain as usual:
Is it possible to position ticklabels on negative $y$ axis on its right side? Ticklabels on positive $y$ axis should remain as usual:
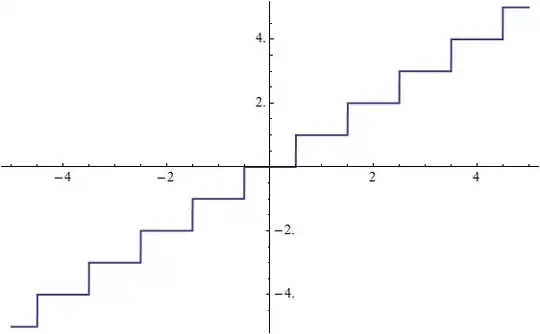
Here's one idea. Notice that the tick-marks are flipped as well.
p = Plot[Round[x], {x, -5, 5}, Exclusions -> None, PlotStyle -> Thick];

ticks = Ticks /. AbsoluteOptions[p];

{yticks, labels} =
   Replace[
     ticks[[2]],
     {a_?Negative, b_, c_, x__} :> {a, Sow@Text[b, {0.3, a}];, -c, x},
     1
   ] // Reap;

Show[p, Graphics[labels], Ticks -> {ticks[[1]], yticks}]
ticks[[2]] -> ticks[[1]] & {0.3, a} -> {a, 0.3}) or for both in two steps.
– Mr.Wizard
Jun 04 '12 at 12:29
Lots of magic numbers, no real scalability and rather specific solution for the given case, but it shows how you can build your own tick function easily from scratch. Since I don't think there is any way to finetune the Axes/AxesStyle/Frame options to suit your needs, this is the best I could suggest at the moment. Or you might want to use David Park's Presentations` package or the CustomTicks` package by Mark Caprio to specify aesthetic tick positions for any range (thanks Szabolcs).
{minX, maxX} = {minY, maxY} = {-5, 5}; (* range *)
{xO, yO} = {0, 0}; (* origo *)
d = .2; (* tick length *)
step = 1; (* tick step *)
offset = 1.5; (* tick label offset *)

Plot[IntegerPart@x, {x, minX, maxX}, Exclusions -> None,
 PlotStyle -> {Black, Thick}, AspectRatio -> 1,
 PlotRange -> {{minX, maxX}, {minY, maxY}}, Axes -> False,
 Epilog -> {
   Black, Line[{{minX, yO}, {maxX, yO}}], Line[{{xO, minY}, {xO, maxY}}],
   Table[{
     Line@{{i, yO}, {i, yO + d}},
     Text[i, {i, yO + d}, {0, -offset}]
     }, {i, minX, xO - 1, step}],(* -x *)
   Table[{
     Line@{{i, yO}, {i, yO - d}},
     Text[i, {i, yO - d}, {0, offset}]
     }, {i, xO + 1, maxX, step}],(* +x *)
   Table[{
     Line@{{xO, i}, {xO + d, i}},
     Text[i, {xO + d, i}, {-offset, 0}]
     }, {i, minY, yO - 1, step}],(* -y *)
   Table[{
     Line@{{xO, i}, {xO - d, i}},
     Text[i, {xO - d, i}, {offset, 0}]
     }, {i, yO + 1, maxY, step}] (* +y *)
   }, PlotRangePadding -> Scaled@.05]

This needs some tweaking, but could be a starting point for a more general solution. The idea is to plot the bottom left quadrant of the plot with a Frame top and right, and the top right quadrant of the plot with a Frame bottom and left. Then Inset those into the complete plot.
bottomleft=Plot[Sin[x],{x,-4,4},Frame->{False,False,True,True},
  FrameTicks->All,PlotRange->{{Automatic,0},{Automatic,0}}];
topright=Plot[Sin[x],{x,-4,4},Frame->{True,True,False,False},
  FrameTicks->All,PlotRange->{{0,Automatic},{0,Automatic}}];

Plot[Sin[x],{x,-4,4},Ticks->False,
  Epilog->{Inset[bottomleft,{0,0},{0,0},Scaled[0.58]],Inset[topright,{0,0},{0,0},Scaled[0.58]]}]

Clearly there is a problem with all the ticks at the origin, and the insets had to be scaled by trial and error, but there might be a way to automate that.