5

As it is common to most of us, when we plot a figure, x label ticks are located above x-axis and y label ticks are located at the right of y-axis. Is there any simple way to alter this in Mathematica? I am more interested in y-axis labels (numbers) because they overlap with the graph content. I would be happy to see them at the right side of the y-axis. Have any idea? Thanks in advance.enter image description here

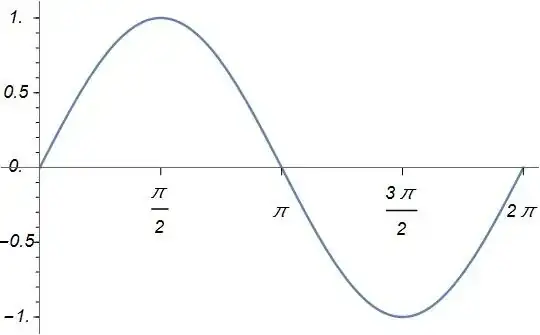
Below is an example. If I move the axis origin to $(0,0)$, then the numbers overlap with the figure. I need to flip both the ticks and the numbers.

Seyhmus Güngören
  • 2,465
  • 1
  • 18
  • 19
  • something like Plot[Cos[x], {x, 0, 10}, Ticks -> {{{Pi, 180 \[Degree], {0, .03}}, {2 Pi, 360 \[Degree], {0, .03}}, {3 Pi, 540 \[Degree], {0, .03}}}, {#, #, {0., .02}} & /@ Range[-1, 1, .2]}]? – kglr Nov 04 '14 at 23:04
  • @kguler in princip yes but I also need the numbers to be flipped as the ticks. Namely, if the y-axis ticks are looking to the left then the numbers should be at right. – Seyhmus Güngören Nov 05 '14 at 00:15
  • 1
    Possible duplicates: (2601), (6395), (42209). (Sadly there is no satisfying answer that I am aware of.) – Mr.Wizard Nov 05 '14 at 00:32
  • @Mr.Wizard I checked the asked questions especially this one : http://mathematica.stackexchange.com/questions/6395/is-it-possible-to-position-ticklabels-on-the-negative-y-axis-on-its-right-side but I was not able to manipulate the answers to get an answer and I believe that it can be more useful it there could be some more practical answer, although I doubt there can be, because it seems a non trival thing. – Seyhmus Güngören Nov 05 '14 at 00:36
  • Although there is one trick you might use, which I shall attempt in a minute, I fear that you may need to draw your own ticks entirely. For an example of what is involved see this: (23910) – Mr.Wizard Nov 05 '14 at 00:39
  • @Mr.Wizard I see. The people are crazy. It is really unbelievable what people can do with this Mathematica and how some simple looking things might need real efforts) – Seyhmus Güngören Nov 05 '14 at 00:46
  • When the system outright lacks the functionality you seek reimplementation can be very painful. :-/ – Mr.Wizard Nov 05 '14 at 00:56

2 Answers2

1

Post-processing the FullGraphics of Plot output to change the positions of ticks and tick labels of the vertical axis:

Graphics[Replace[First[FullGraphics[plt1 = Plot[Sin[x], {x, 0, 10}]]],
  {Text[a_, b_, {1., 0.}] :> Text[Pane[a, 30, Alignment -> Left], b, -{2, 0}],
   Line[{{0., b_ /; b != 0}, {c_, b_}}] :> Line[{{0., b}, {-3 c, b}}]}, {0, Infinity}],
   ImageSize -> 500, plt1[[2]][[1]]]

enter image description here

kglr
  • 394,356
  • 18
  • 477
  • 896
  • Is it possible to have exactly the same style (the number of ticks, the outlook and the number of numbers (-1,-0.5,0,0.5,1 in this example)) of the ticks of the original figure. – Seyhmus Güngören Nov 05 '14 at 01:48
  • 2
    Sadly this no longer works in version 10 as FullGraphics is broken. This was the first thing I tried. – Mr.Wizard Nov 05 '14 at 01:58
  • @Mr.Wizard & seyhmus, this has some glitches in V9 too; FullGraphics[plt1] "should" display the same as plt1 but it doesn't; it changes the ticks. I am afraid creating ticks and labels separately (that is, not relying on post-processing) seems to be the only way to go. – kglr Nov 05 '14 at 09:00
1

Well, if the elegant method of kguler does not work in Mma 10, one can draw everything "by hand":

     lst1 = Join[Table[Line[{{-0.05, 0.1 i}, {0, 0.1 i}}], {i, -10, 10, 1}], 
   Table[Line[{{-0.08, 0.5 i}, {0, 0.5 i}}], {i, -2, 2, 1}]];
lst2 = Table[Text[Style[0.5 i, 12, Italic], {-0.3, 0.5 i}], {i, -2, 2, 1}];
lst3 = Table[Line[{{\[Pi]*i/2, -0.05}, {\[Pi]*i/2, 0}}], {i, 1, 4, 1}];
lst4 = Table[Text[Style[\[Pi]*i/2, 12, Italic], {\[Pi]*i/2, -0.3}], {i, 1, 4,1}];

Show[{
  Plot[Sin[x], {x, 0, 2 \[Pi]}, Ticks -> None, 
   PlotRange -> {{-0.5, 2 \[Pi]+0.5}, Automatic}],
  Graphics[{lst1, lst3}],
  Graphics[{lst2, lst4}]
  }]

yielding this: enter image description here

Have fun!

Alexei Boulbitch
  • 39,397
  • 2
  • 47
  • 96