2

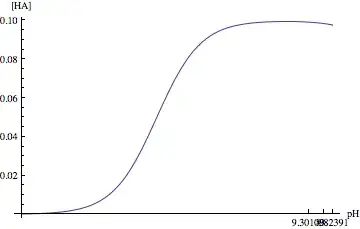
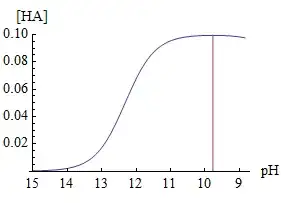
I need to change the ticks in the xaxis for representation pH values, but the ticks are not dispersed along the range of xaxis. Another question: why the vertical line defined with Epilog is not visible?

Kb1 := Kw/Ka1
Kb2 := Kw/Ka2
oh := Kw/x
f[x_] := Cs Kb2 oh/(Kb2 oh + oh^2 + Kb1 Kb2)
ff[x_] = Simplify[f[x]]
Ka1 = 6.2 10^-8
Ka2 = 4.8 10^-13
Cs = 0.1
myTicks[xmin_, xmax_] := {#, -N[Log[10, #]]} & /@FindDivisions[{xmin, xmax}, 5]
LogLinearPlot[ff[x], {x, 1. 10^-15, 15 10^-10},  AxesLabel -> {"pH", "[HA]"}, Ticks -> {myTicks, Automatic},  PlotRange -> All, Epilog -> 
 Line[{{Log[10, 1.725 10^-10], 0}, {Log[10, 1.725 10^-10], 0.1}}]]

enter image description here

Jorge
  • 123
  • 3

2 Answers2

5

Version 9

I made findD for that.

findD[{x1_, x2_}, n_] := FindDivisions[-Log[10, #] & /@ {x1, x2}, n]
myTicks[xmin_, xmax_] := {10^-#, #} & /@ findD[{xmin, xmax}, 10]

Have try this code.

Kb1 := Kw/Ka1; Kb2 := Kw/Ka2; oh := Kw/x; f[x_] := Cs Kb2 oh/(Kb2 oh + oh^2 + Kb1 Kb2); ff[x_] = Simplify[f[x]]; Ka1 = 6.2 10^-8; Ka2 = 4.8 10^-13; Cs = 0.1;

LogLinearPlot[ff[x], {x, 1. 10^-15, 15 10^-10},
    AxesLabel -> {"pH", "[HA]"},
    Ticks -> {myTicks, Automatic},
    PlotRange -> All
]

Blockquote

and AbsoluteOptions[%, PlotRange] show that your code Epilog-> Line[{{Log[10, 1.725 10^-10], 0}, {Log[10, 1.725 10^-10], 0.1}} is out of range, so this is my trick for your Epilog line.

LogLinearPlot[{ff[x], 1/(x - 1.725 10^-10)}, {x, 1. 10^-15, 15 10^-10},
 AxesLabel -> {"pH", "[HA]"},
    Ticks -> {myTicks, Automatic},
     PlotRange -> {0, 0.1}
]

Blockquote

version 10

LogLinearPlot does not work as function of Ticks in the version 10, and I think that this might be a bug. ( here is related ) So use Ticks -> {myTicks[1. 10^-15, 15 10^-10], Automatic}

LogLinearPlot[{ff[x], 1/(x - 1.725 10^-10)}, {x, 1. 10^-15, 15 10^-10}, 
    AxesLabel -> {"pH", "[HA]"}, 
    Ticks -> {myTicks[1. 10^-15, 15 10^-10], Automatic}, 
    PlotRange -> {0, 0.1}
]

enter image description here

Junho Lee
  • 5,155
  • 1
  • 15
  • 33
3

In version 10,

LogLinearPlot[ff[x], {x, 10^-15, 15 10^-10}, Frame -> True, 
 FrameTicks -> {{Automatic, 
    Automatic}, {Table[{10^j, -j}, {j, -15, -9}], None}}, 
 FrameLabel -> {"pH", "[HA]"}, 
 GridLines -> {{{1.725 10^-10, Red}}, None}]

enter image description here

ubpdqn
  • 60,617
  • 3
  • 59
  • 148