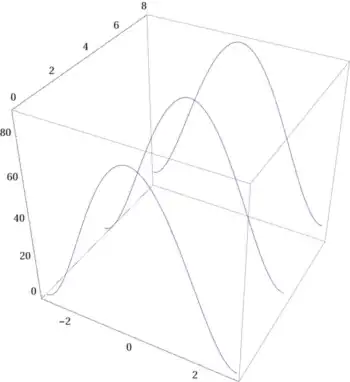
I have a function (x^2-9)^2. I can plot it with x-range{-3,3} so that three extremum s can appear in the plot. I add another axis y ranging{0,10}. I want to plot the previous function (x^2-9)^2 at y=0,4,8. Obviously the last two will be the replica of the first one. Just have a look in the image for a rough idea..
Asked
Active
Viewed 158 times
0
Abhijit Saha
- 449
- 1
- 4
- 10
2 Answers
0
For start introduce another parameter v:
ParametricPlot3D[ { v,u, (u^2 - 9) ^2 }, {u,3,3},{v,0,8}, Mesh->10]
Narasimham
- 3,160
- 13
- 26
Graphics3D[ MapIndexed[ Cases[ #, Line[L_] :> Line[Thread[{L[[All, 1]], #2[[1]]/5, L[[All, 2]]}]], -1] &, Table[Plot[(x^2 - 9)^2, {x, -3, 3}], {10}]], Axes -> False, ImageSize -> 600, BoxRatios -> {1, 1, 1}, Boxed -> False]– Sektor Nov 12 '14 at 11:14