3

I am using RegionPlot to plot a linear program

maximize 30x1+25x2

with the constraints

x1+x2 <= 10
x1 <= 6
x2 <= 9
5x1 + 2x2 <= 30
x1,x2 >= 0

Using the following command

RegionPlot[ x1 + x2 <= 10 && 
            x1 <= 6 &&
            x2 <= 9 &&
            x1 >= 0 &&
            x2 >= 0,
            {x1, 0,   10}, x2, 0, 10},
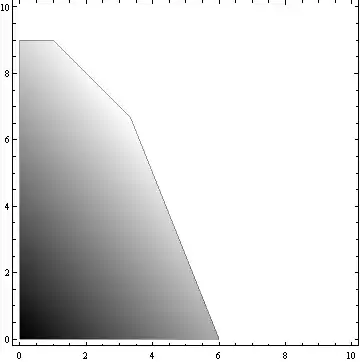
            ColorFunction -> Function[{x1, x2}, 30 x1 + 25 x2],
            ColorFunctionScaling -> True]

this is my result enter image description here

How can i change the color an scale it all over the region ? I tried ColorFunctionScaling->True but this does not change anything.

JHnet
  • 133
  • 5

3 Answers3

4

There is a common misconception about what ColorFunctionScaling -> really does. It DOESN'T rescale the VALUES of the ColorFunction[] thingy, but the COORDINATES before feeding them into it.

Just look:

s = Reap@RegionPlot[x1 > x2, {x1, 0, 10}, {x2, 0, 10}, 
                   ColorFunction -> Function[{x1, x2}, Sow[x1 + x2]], 
                   ColorFunctionScaling -> #] & /@ {True, False};
{Min @ #, Max @ #} & /@ s[[All, 2]]
(* {{1.71127*10^-20, 2.}, {0.00205697, 19.9979}} *)

so:

ClearAll[x1, x2, col, const]; 

const = x1 + x2 <= 10 && 0 <= x1 <= 6 && 0 <= x2 <= 9 && 5 x1 + 2 x2 <= 30;
col[x1_, x2_] := 30 x1 + 25 x2
{min, max} = First /@ {Minimize @@ #, Maximize @@ #} &@{{col[x1, x2], const}, {x1, x2}};
RegionPlot[const, {x1, 0, 10}, {x2, 0, 10}, 
           ColorFunction -> Function[{x1, x2}, Rescale[col[x1,x2], {min, max}, {0, 1}]], 
           ColorFunctionScaling -> False]

Mathematica graphics

Dr. belisarius
  • 115,881
  • 13
  • 203
  • 453
2

You can scale the ColorFunction manually:

RegionPlot[
 x1 + x2 <= 10 && x1 <= 6 && x2 <= 9 && x1 >= 0 && x2 >= 0, {x1, 0, 10}, {x2, 0, 10}, 
 ColorFunction -> Function[{x1, x2}, Rescale[30 x1 + 25 x2, {0, 300}, {0, 1}]], 
 ColorFunctionScaling -> False
]

enter image description here

ArgentoSapiens
  • 7,780
  • 1
  • 32
  • 49
  • ok, then i have to adjust the values until it looks good. I thought there would be an automatic option, that allows automatic scaling i.e. white is on (0,0), red is max value of 30x1+25x2 – JHnet Nov 12 '14 at 16:40
2
RegionPlot[ x1 + x2 <= 10 && x1 <= 6 && x2 <= 9 && x1 >= 0 && x2 >= 0, {x1, 0, 10}, {x2, 0, 10},
           ColorFunction -> ( (30 # + 25 #2)/(30 + 25) &)]
(* or ColorFunction -> Function[{x, y}, (30 x + 25 y)/(30 + 25)] *)

enter image description here

white is on (0,0), red is max value of 30x1+25x2:

RegionPlot[x1 + x2 <= 10 && x1 <= 6 && x2 <= 9 && x1 >= 0 && x2 >= 0,
         {x1, 0, 10}, {x2, 0, 10},
 ColorFunction -> (Blend[{White, Red}, (30 # + 25 #2)/55] &)]

enter image description here

Row[RegionPlot[x1 + x2 <= 10 && x1 <= 6 && x2 <= 9 && x1 >= 0 && x2 >= 0, 
              {x1, 0, 10}, {x2, 0, 10},
              ColorFunction -> (#), PlotLabel -> Style[#, "Panel", 16]] & /@
     {RGBColor[0, 1, 0, (5 # + 50 #2)/55] &,
      RGBColor[1, 0, 0, (275 # + 275 #2)/550] &,
      RGBColor[0, 0, 1, (50 # + 5 #2)/55] &}, Spacer[5]]

enter image description here

Row[RegionPlot[x1 + x2 <= 10 && x1 <= 6 && x2 <= 9 && x1 >= 0 && x2 >= 0,
              {x1, 0, 10}, {x2, 0, 10},
              ColorFunction -> (#), PlotLabel -> Style[#, "Panel", 16]] & /@  
     {Blend[{White, Red}, (5 # + 50 #2)/55] &, 
      Blend[{White, Red}, (275 # + 275 #2)/550] &, 
      Blend[{White, Red}, (50 # + 5 #2)/55] &}, Spacer[5]]

enter image description here

kglr
  • 394,356
  • 18
  • 477
  • 896