This code: (by @kguler, can be found here, as an answer to "How to shade a plotted region in specific direction?")
Row[RegionPlot[x1 + x2 <= 10 && x1 <= 6 && x2 <= 9 && x1 >= 0 && x2 >= 0,
              {x1, 0, 10}, {x2, 0, 10},
              ColorFunction -> (#), PlotLabel -> Style[#, "Panel", 16]] & /@
     {Blend[{White, Red}, (5 # + 50 #2)/55] &,
      Blend[{White, Red}, (275 # + 275 #2)/550] &,
      Blend[{White, Red}, (50 # + 5 #2)/55] &}, Spacer[5]]
will produce this:

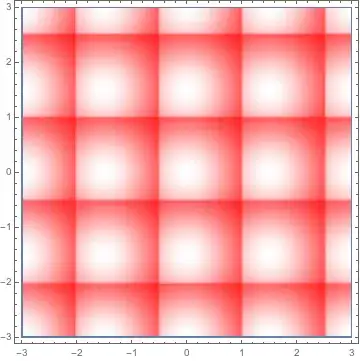
However, I would like to produce filling of the area with some sort of cushion effect, like individual cells in following examples:

or:
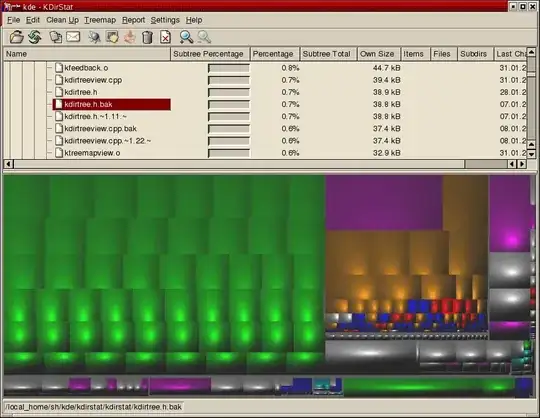
How to do this?