There is an interesting discussion on performance of Sum[] in this question.
I actually wanted to reproduce findings from this answer.
So, I entered:
ListLogPlot[
 Table[First@AbsoluteTiming@Sum[x, {x, 1, Round[10^k]}], {k, 1, 10,
   0.1}], PlotRange -> All, Joined -> True]
and got:

which is somewhat different from the graph from the answer that I linked to above:
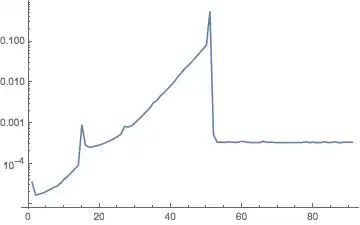
(I don't mean trivial differences like y-axis scale, etc; I mean qualitative differences, like absence or presence of smaller spikes, relation between values for 30, 40, 50)
What happens on your machine? Why the difference?
AbsoluteTimingis system dependent. For example, on my Win 7 PC, I never get a value between 0 and 0.0005, so that's probably the resolution of some clock thatAbsoluteTiminguses. If you compare only timings large compared to the clock resolution (e.g. t > 0.01), the graphs do look very similar. – Niki Estner Nov 13 '14 at 14:34