13

In the announcement of Mathematica 10 there were some very cool features for every geo-related researcher. Like this one

what i'm trying to do is to overlay an ContourPlot onto this beautiful arctic projection.

My data has the Form

data={{lat_1,lon_1,value_1},{lat_2,lon_2,value_2},....

From here i've learned how to plot Points, Circles or Lines on this Arctic Plot but i was unable to add an contour plot...

this plot is computed with NCLsea ice concentration, plotted with NCL

this is how i would like it to be ...

thanks !


Edit 26.Nov

thanks @jose,

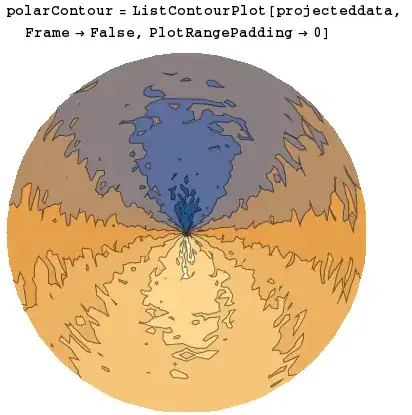
your approach gives me this:

Imgur

it seems as if Mathematica is rasterizing the contour plot which does not look so good i think.

there is also something wrong with the coordinates. i have a 360x180 Matrix, most of it are NaN's but nevertheless i have to manually adjust the Polygon Size because:

 ...Polygon[GeoPosition[{{-90, -180}, {-90, 180}, {90, 180}, {90, -180}}]]

makes everything worse... any further ideas anyone ?

2 Answers2

6

I think you first need to start by generating the graphics with ListContourPlot. For example, take this arbitrary data as a 31x31 matrix:

data = Table[Exp[-(90 - lat) Degree] Cos[lon Degree] + RandomReal[0.2], {lat, 60, 90}, {lon, -180, 180, 12}];

and construct the contour plot:

g = ListContourPlot[data, Frame -> False, PlotRangePadding -> 0]

Use the many options of LisContourPlot to get the graphics as you need.

Now you can call GeoGraphics with a geo styled polygon and partial opacity:

GeoGraphics[{
    GeoStyling[{"GeoImage", g}, Opacity[0.6]],
    Polygon[GeoPosition[{{60, -180}, {60, 180}, {90, 180}, {90, -180}}]]
  },
  GeoProjection -> {"LambertAzimuthal", "Centering" -> {90, 0}},
  GeoRange -> {{50, 90}, All},
  GeoGridLines -> Automatic,
  GeoZoomLevel -> 3
]

Note the use of an azimuthal projection. GeoGraphics would automatically choose that projection and center it at the pole so the GeoProjection option is actually redundant here.

jose
  • 6,328
  • 1
  • 14
  • 24
6

Expanding a bit @jose answer, instead of using the GeoStyling directive, maybe using the plot data is better. Let's generate a random sample, but with the same format as yours:

data = Join @@ Table[{lat, lon, 
 Exp[-(90 - lat) Degree] Cos[lon Degree] + RandomReal[0.2]}, {lat,
  50, 90}, {lon, -180, 180, 5}];

Then we should use ListContourPlot in the same projection we will use in the map, so first let's project it:

projecteddata = Join[GeoGridPosition[
 GeoPosition[data[[All, ;; 2]]], {"LambertAzimuthal", 
  "Centering" -> {90, 0}}][[1]], data[[All, {3}]], 2];

And then plot with ListContourPlot:

polarContour = ListContourPlot[{Sequence @@ (GeoGridPosition[
     GeoPosition[#[[;; 2]]], {"LambertAzimuthal", 
      "Centering" -> {90, 0}}][[1]]), #[[3]]} & /@ data,
      Frame -> False, PlotRangePadding -> 0]

polar contour

Then you can overlay it over the polar map:

GeoGraphics[{Opacity[.5], polarContour[[1]]},
  GeoProjection -> {"LambertAzimuthal", "Centering" -> {90, 0}}, 
  GeoRange -> {{50, 90}, All}, GeoGridLines -> Automatic, 
  GeoZoomLevel -> 3]

polar map with contour

Just a final warning: be careful when projecting very sparse data, it might give you weird plots if you don't fill intermediate points.

FJRA
  • 3,972
  • 22
  • 31