8

I have a set of data for world marine piracy. I'd like to build polygons encircling areas of active piracy.

So to start with I get piracy data and make a heatmap from it.

asamjson=Import["http://msi.nga.mil/MSI_JWS/ASAM_JSON/getJSON?typename=\
DateRange_AllRefNumbers&fromDate=19900101&toDate=20140801", 
    "JSON"];
Needs["GeneralUtilities`"]
asamdataset = Dataset[ToAssociations@asamjson];
piracyLocations = 
  Map[GeoPosition[ToExpression@{#["lat"], #["lng"]}] &, asamdataset];

sdh = SmoothDensityHistogram[
  Reverse[First[#]] & /@ (Normal@piracyLocations)[[1 ;; 4000]], 
  ColorFunction -> "SunsetColors", 
  PlotRange -> {{-180, 180}, {-90, 90}}];
GeoGraphics[{Opacity[0.6], sdh[[1]]}, GeoBackground -> "ReliefMap"]

enter image description here

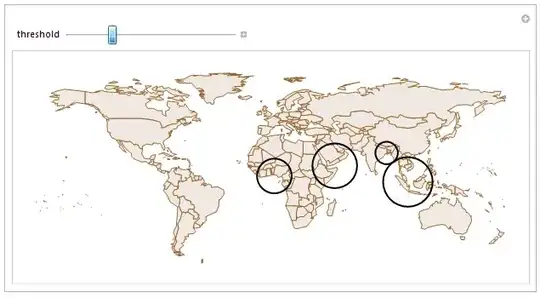
Next I'd like to build polygons encircling areas of piracy (Areas where the histogram is more than some threshold value), or perhaps within 100 miles of any past event.

I'm unsure of how to do this, though I know I've seen it done in demonstrations before. All the methods that spring to mind are computationally infusible.

What am I missing?

Edit: Here's my progress along a different approach.

p = Map[GeoDisk[#, 100000] &, Flatten[c, 1]];
GeoGraphics[p, GeoRange -> {{-40, 20}, {-20, 25}}, Frame -> True]

enter image description here

So with this approach I put a GeoDisk at each piracy location. I can vary the size of the GeoDisks to include more territory (say 100Km away from piracy locations).

So now the problem is simplified to building a bounding polygon on those GeoDisks. I think this simplifies the problem somewhat. Something like ConvexHullMesh would work, if it would work from the outside of the geoDisk. Obviously that's a bit problematic. But it's a thought.

There's a few stray events quite far from land which I can remove by hand.

  • 1
    You may get good reponses to this piracy-related question, but I'm afraid this other post gets to claim the booty.. – Daniel Lichtblau Nov 25 '14 at 22:17
  • arrr!! Yea be right. We may be righteous, but we got no booty! –  Nov 25 '14 at 22:22
  • In seriousness, I hope you do get good answers because it's an interesting question... – Daniel Lichtblau Nov 25 '14 at 22:27
  • I'm positive I've seen it (or a version of it) in examples before. I just can't remember where. –  Nov 25 '14 at 22:29
  • ...But that other question grabbed so much attention that everyone has gotten behind in their work today. – Daniel Lichtblau Nov 25 '14 at 22:30
  • Would GeoDisk or GeoCircle be of use here? Or is the issue a matter of where to locate them? – Daniel Lichtblau Nov 25 '14 at 22:46
  • @Steven, how many ways to spell pirate? asamdataset[Tally /* SortBy[Last] /* Reverse, "Aggressor"] – alancalvitti Nov 26 '14 at 01:01
  • It's freeform data reported by victims. In their defence, thieves and pirates should be counted differently. The outcomes are very, very different. –  Nov 26 '14 at 01:07
  • "Areas where the histogram is more than some threshold value" Have you considered ContourPlot or RegionPlot applied to a SmoothKernelDistribution? After all, a SmoothDensityHistogram is basically a DensityPlot of the SmoothKernelDistribution of the data. –  Nov 26 '14 at 04:38
  • @Rahul that would generate a plot of what I'd like - good to visualize, but I'm trying to get a bounding polygon of the areas. I'm using the bounding polygon to load into google earth and other apps for filtering. –  Nov 26 '14 at 21:23

2 Answers2

6

The approach to address the encircling areas will be using the Graph fucntionality available in Mathematica. There are some null values in the dataset so we'll remove them in the new dataset piracyLocations.

asamjson = 
Import["http://msi.nga.mil/MSI_JWS/ASAM_JSON/getJSON?typename=\
DateRange_AllRefNumbers&fromDate=19900101&toDate=20140801", "JSON"];
Needs["GeneralUtilities`"]
asamdataset = Dataset[ToAssociations@asamjson];
piracyLocations = asamdataset[
Select[Head@ToExpression[#lat] == Real && 
  Head@ToExpression[#lng] == Real &], <|
 "lat" -> ToExpression[#lat], "lng" -> ToExpression[#lng], 
 "geoPosition" -> 
  GeoPosition[{ToExpression[#lat], ToExpression[#lng]}]|> &];

We'll generate the encircling areas by bundling together all the points that are closer 75 km to any other event, then extracting the connected vertices, which we'll represent areas of interest.

With[{radius = 75000, 
   d = piracyLocations[All, 
      GeoPositionXYZ[#geoPosition][[1, ;; 2]] &] // Normal}, 
  coords = piracyLocations[All, {#lat, #lng} &] // Normal; 
  g = ConnectedComponents[
    AdjacencyGraph[
     Boole[RegionMember[Disk[#, radius]][d] & /@ d] - 
      DiagonalMatrix[ConstantArray[1, Length@d]]]]];

There are repeated coordinates in the dataset, so to address this I've had to use the Union functionality. I discarded isolated events, or groups with 4 or less events.

c = Select[Union[coords[[g[[#]]]]] & /@ Range@Length@g, 
  Length[#] > 4 &]

The following function allows me to obtain the boundary of the region. Had to go this route because you can't combine Graphics with GeoGraphics so Trying to incorporate the ConvexHull representation in the GeoGraphics didn't pan out.

area[coordList_] := {EdgeForm[Red], 
  Polygon[GeoPosition[
    MeshPrimitives[ConvexHullMesh[coordList], 2][[1, 1, All]]]]}

Manipulate[
 GeoGraphics[area[c[[i]]], ImageSize -> Large], {{i, 1}, 1, Length@c, 
  1}, SynchronousUpdating -> False]

enter image description here

Zviovich
  • 9,308
  • 1
  • 30
  • 52
  • This is certainly a good start. And I am surprised it used graphs to do it. So now the trick is to extend it to encircle some distance around all the piracy events - So the resulting polygon captures the area around where piracy is active, rather than just the area between piracy events. This is the part that I'm having the most trouble with. –  Nov 27 '14 at 02:03
2

The following approach will address the requirement Areas where the histogram is more than some threshold value...

asamjson = 
  Import["http://msi.nga.mil/MSI_JWS/ASAM_JSON/getJSON?typename=\
DateRange_AllRefNumbers&fromDate=19900101&toDate=20140801", "JSON"];
Needs["GeneralUtilities`"]
asamdataset = Dataset[ToAssociations@asamjson];

asamdataset = 
 asamdataset[
  Select[Head@ToExpression[#lat] == Real && 
     Head@ToExpression[#lng] == Real &]]
piracyLocations = 
  Map[GeoPosition[ToExpression@{#["lat"], #["lng"]}] &, asamdataset];
histo = SmoothDensityHistogram[
  Reverse[First[#]] & /@ (Normal@piracyLocations), 
  ColorFunction -> GrayLevel, PlotPoints -> 200, 
  PlotRange -> {{-180, 180}, {-90, 90}}, PlotRangePadding -> None, 
  Frame -> None];
Manipulate[
 areas = Circle[{#[[1, 1]] - 180, (#[[1, 2]] - 180)/
       2}, #[[2]]] & /@ (ComponentMeasurements[
      MorphologicalComponents[histo, 
       threshold], {"BoundingDiskCenter", "BoundingDiskRadius"}][[All,
       2]]); Show[
  Graphics[{EdgeForm[Brown], FaceForm[LightBrown], 
    CountryData["World", "SchematicPolygon"]}], 
  Graphics[{Thick, areas}], ImageSize -> Large], {{threshold, .4}, .1,
   1}, SynchronousUpdating -> False]

enter image description here

Zviovich
  • 9,308
  • 1
  • 30
  • 52