9

I have plot generated by Plot[] function that I want to export to pdf file. The problem is that Export[] function somehow cuts a tiny bit of plot on the left side which results in something like this: Exported image

I'd like to know what should I do to get exported file without cropped $0$.

qoqosz
  • 193
  • 5
  • 3
    It's always best if you provide an example of the code you used. But even without that, I would suggest manually setting the Plot option ImagePadding -> 70 (or use a larger number). – Jens Jun 22 '12 at 17:20
  • @Jens thanks, that works good. – qoqosz Jun 22 '12 at 17:25

2 Answers2

10

Please try adding some space around the plot:

Plot[2 Sin[x] + x, {x, 0, 15}, Filling -> Bottom, ImageMargins -> 10]

ImageMargins gives a margin around the existing plot that can be seen by selecting the graphic (the outer orange frame):

enter image description here

By comparison ImagePadding is used by Plot itself to make room for the axes labels (the inner orange frame).

Mr.Wizard
  • 271,378
  • 34
  • 587
  • 1,371
  • Thanks, but proposed ImagePadding option works good and is sufficient for my needs. – qoqosz Jun 22 '12 at 17:27
  • @qoqosz actually I didn't see that comment above, and also I was confusing ImageMargins with ImagePadding; you can use ImageMargins directly in Plot and that would be a good method because you can use a small fixed value without cutting of the labels, as you would with ImagePadding. – Mr.Wizard Jun 22 '12 at 17:30
  • Ok, good to know :) – qoqosz Jun 22 '12 at 17:31
5

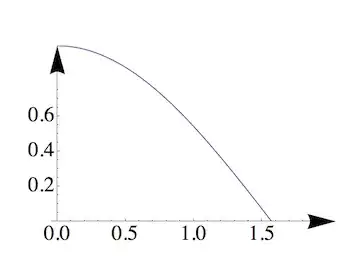
Here is my original suggestion using ImagePadding:

p = Plot[Cos[x], {x, 0, 2}, AxesStyle -> Arrowheads[.1], 
  PlotRange -> {0, 1}, TicksStyle -> Large, RotateLabel -> False, 
  ImagePadding -> 70]

imagemargins

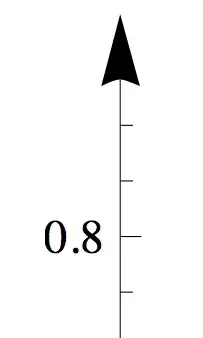
And here is an example of how to use ImageMargins in the plot command:

p = Plot[Cos[x], {x, 0, 2}, AxesStyle -> Arrowheads[.1], 
  PlotRange -> {0, 1}, TicksStyle -> Large, RotateLabel -> False, 
  ImageMargins -> 70]

Both methods work to give you extra space around the image. But I see Mr. Wizard just now explained this already.

Edit: a note for completeness

In a related question, one can see that neither ImagePadding nor ImageMargins work in some situations. Here is an example where Epilog is used to place a text below a plot:

Plot[Sin[x], {x, 0, 2 Pi}, 
 Epilog -> {Text["Show me the text", {Pi, -1.3}]}]

The text is not shown because it falls outside the PlotRange. When this happens, you can fix the problem by using PlotRangePadding:

Plot[Sin[x], {x, 0, 2 Pi}, 
 Epilog -> {Text["Show me the text", {Pi, -1.3}]}, 
 PlotRangePadding -> .5]

plot with epilog

Jens
  • 97,245
  • 7
  • 213
  • 499