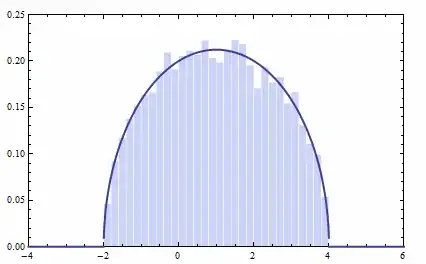
With Mathematica 10, it's possible to draw the semicircle distribution of R. Wigner:
data = RandomVariate[WignerSemicircleDistribution[1, 3], 10^4];

Show[
  Histogram[data, 20, "PDF"],
  Plot[PDF[WignerSemicircleDistribution[1, 3], x], {x, -2, 4}, PlotStyle -> Thick]]

My question is: how can I make an animated version of Wigner semicircle distribution as shown below?

Dynamic[
Show[ Histogram[data, 10, "PDF"], Plot[PDF[WignerSemicircleDistribution[0, 1], x], {x, -2, 4}, PlotStyle -> Thick] , PlotRange -> 2] , UpdateInterval -> .2]`
– Kuba Feb 23 '15 at 08:42GIFis also desired, or just an embedded movie, I would say this could be a duplicate of Is it possible to insert an animated image into Mathematica notebook?. The workflow would simply be to first create aGIFfrom within Mathematica, then re-import that using the functionmakeAnimationin my answer. That function fixes a bug which leads to a hard crash when you right-click on the animation created usingKuba's method (in version 8). – Jens Feb 23 '15 at 17:10