How do I draw specific filled regions in DateListPlot? I trying to plot something like this:
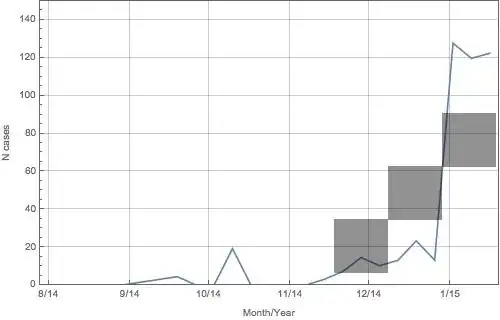
Thanks
How do I draw specific filled regions in DateListPlot? I trying to plot something like this:
Thanks
One approach is to use Inset.
DateListPlot[{1, 1, 2, 3, 5, 8, 11}, {2000, 8}, Prolog -> Inset[Graphics[{GrayLevel[.6],
  Rectangle[Scaled[{.5, .1}], Scaled[{.7, .3}]],
  Rectangle[Scaled[{.7, .3}], Scaled[{.9, .5}]],
  Rectangle[Scaled[{.9, .5}], Scaled[{1.1, .7}]]}]]]

Some experimentation may be necessary to place multiple shaded areas in their desired locations.
Using @bbgodfrey's example
list = {1, 1, 2, 3, 5, 8, 11};
pnts = Thread[{AbsoluteTime /@ ({2000, #} & /@ Range[8, 14])[[3 ;; 6]], list[[3 ;; 6]]}];

DynamicModule[{pts = pnts}, LocatorPane[Dynamic[pts], DateListPlot[{1, 1, 2, 3, 5, 8, 11},
 {2000, 8}, Epilog -> {Opacity[.5, Gray], Dynamic[Rectangle @@@ Partition[pts, 2, 1]]},
 Joined -> True], Appearance -> None]]