Similar to (Changing the atom color for plotting xyz-files), I want to take a molecule and then simply change the colors of individual atoms. I don't want to change all atoms of a type to a color (say, make all carbons purple) but individual atoms and bonds.
Asked
Active
Viewed 500 times
3
1 Answers
5
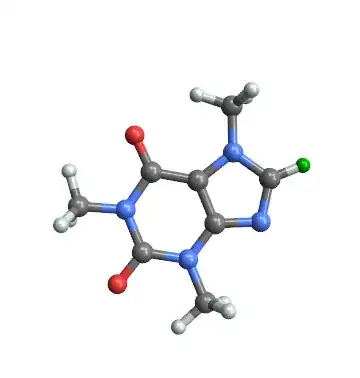
With caffeine as the example molecule
molecule = Import["ExampleData/caffeine.xyz"]
one can find all spheres that represent the single atoms using
sphereList = Cases[molecule[[1, 4, 2]], _Sphere]
{Sphere[1,24.],Sphere[12,24.],Sphere[14,24.],Sphere[15,24.],Sphere[16,24.],Sphere[17,24.],
 Sphere[18,24.],Sphere[22,24.],Sphere[23,24.],Sphere[24,24.],Sphere[3,34.],Sphere[5,34.],
 Sphere[6,34.],Sphere[7,34.],Sphere[10,34.],Sphere[13,34.],Sphere[19,34.],Sphere[20,34.],
 Sphere[2,32.],Sphere[4,32.],Sphere[8,32.],Sphere[21,32.],Sphere[9,31.],Sphere[11,31.]}
As the new color I define
newColor = RGBColor[0, 0.58, 0]
Now one can pick a specific atom out of the list of spheres, e.g. the the rightmost atom, and change its color using
molecule /. {x___, color_RGBColor, s___Sphere, Sphere[12, 24.], z___} ->
             {x, color, s, newColor, Sphere[12, 24.], color, z}
or use a Manipulate to pick the atom and to choose the color
Manipulate[
 molecule /. {x___, color_RGBColor, s___Sphere, sphere, z___} ->
             {x, color, s, nc, sphere, color, z},
 {sphere, sphereList}, {nc, Green}]

If you want to change the color of multiple atoms:
Manipulate[
 Fold[ReplaceAll, molecule, {{x___, color_RGBColor, s___Sphere, sphereList[[#]], z___} ->
      {x, color, s, nc, sphereList[[#]], color, z}} & /@ spheres],
 {{spheres, {1}}, Range[Length@sphereList], ControlType -> CheckboxBar}, {nc, Green}]

A version to change the color of some atoms and single bonds
cylinderList = Cases[molecule[[1, 4, 2]], _Cylinder];
Manipulate[
 Fold[ReplaceAll,
  Fold[ReplaceAll,
   molecule, {{x___, color_RGBColor, s___Sphere, sphereList[[#]], z___} ->
    {x, color, s, ncS, sphereList[[#]], color, z}} & /@ spheres],
   {{x___, color_RGBColor, s___Cylinder, cylinderList[[#]], z___} ->
    {x, color, s, ncC, cylinderList[[#]], color, z}} & /@ cylinders],
 {{cylinders, {1}}, Range[Length@cylinderList], ControlType -> CheckboxBar},
 {{spheres, {1}}, Range[Length@sphereList], ControlType -> CheckboxBar},
 {ncS, Darker@Green}, {ncC, Darker@Green}]

And thanks to the comment by Michael E2 a version that changes the color of the selected atoms and their bonds
Manipulate[
 Fold[ReplaceAll,
  molecule, {a : Sphere[#, _] | Cylinder[{#, _} | {_, #}, _] :> {nc, a}} & /@ atoms],
 {{atoms, {1}}, Range[Length@sphereList], ControlType -> CheckboxBar}, {nc, Darker@Green}]

-
4Nice implementation. I wish Wolfram would admit that there exists in this world multiple bonds. It makes creating one's own molecule viewer a necessity at present. – bobthechemist Mar 11 '15 at 01:26
-
1+1. This seems a more straightforward substitution that captures an atom and its bonds:
With[{n = 8}, molecule /. a : Sphere[n, _] | Cylinder[{n, _} | {_, n}, _] :> {Purple, a}]– Michael E2 Mar 11 '15 at 03:57 -
@MichaelE2 Thank you for your substitution code. I added a version of it to the code. I also added a
Manipulateto choose single bonds. – Karsten7 Mar 11 '15 at 04:43 -
@bobthechemist Part of the problem seems to be that the XYZ file format does not include bond information (right?). The MOL2 format does have it, but showing bond multiplcity does not seem to be possible. – Michael E2 Mar 11 '15 at 14:51
-
1@MichaelE2 Right, XYZ doesn't provide that information. I'm complaining about how
ChemicalDataknows bond multiplicityChemicalData["Caffeine", "EdgeTypes"]but refuses to show itChemicalData["Caffeine", "MoleculePlot"]in 3D. The "StructureDiagram" seems to be chemically correct. – bobthechemist Mar 11 '15 at 17:08
InputFormof the molecule and try changing some of the options manually. – Sektor Mar 10 '15 at 20:46