fixed in 10.1 (windows)
I'm running into trouble getting the right PlotMarkers in the legend of a ListPlot of many curves. Simple example:
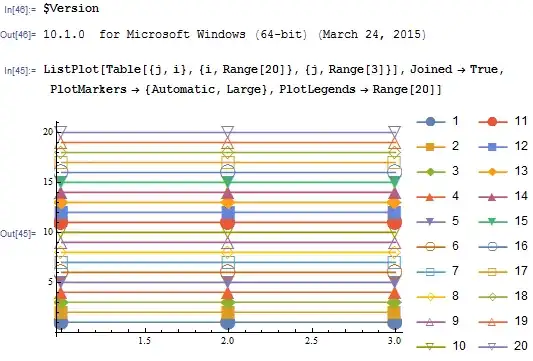
ListPlot[Table[{j, i}, {i, Range[20]}, {j, Range[3]}], Joined -> True,
    PlotMarkers -> {Automatic, Large}, PlotLegends -> Range[20]]
produces:
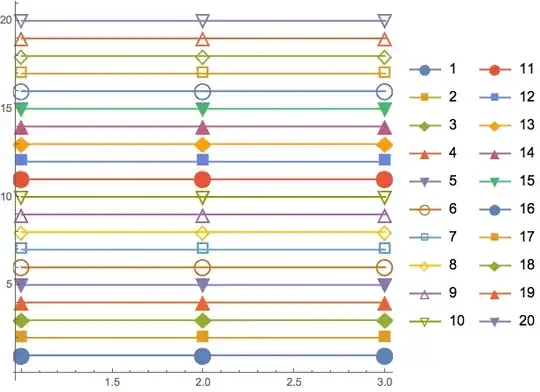
The legend has the right colors for all curves, but after the fifteenth curve, the markers reset instead of continuing to cycle as they do in the actual plot. If I use PlotLegends->Automatic instead of PlotLegends->Range[20], the legend simply stops with the fifteenth curve.
Any idea what might be going on here?
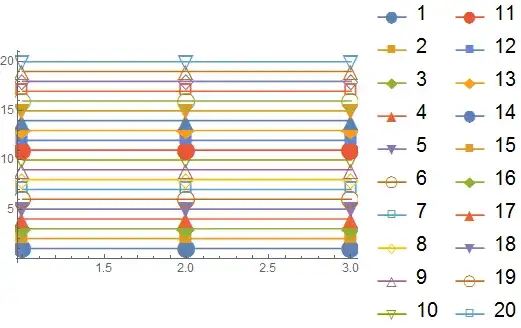
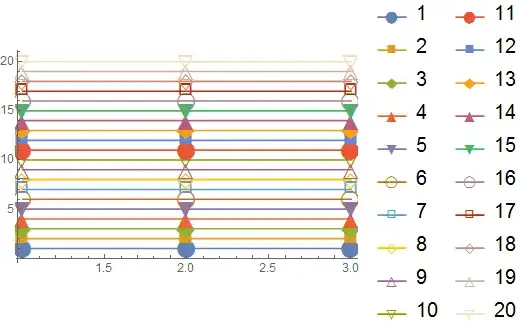
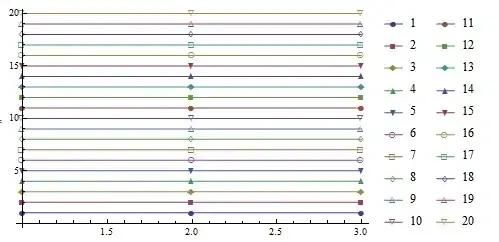
EDIT: Thanks everybody! There are several different good solutions below. A couple people suggested that this is a bug, so I've added that tag.


ListLinePlotinstead ofListPlotandJoined -> True-- it doesn't help this particular problem but it is shorter and seems to be better supported, e.g. (58808) – Mr.Wizard Mar 11 '15 at 21:21ListLinePlot. I'm in the habit of usingJoined->Truebecause it makes it easy to switch amongListPlot,ListLogPlot,ListLogLinearPlot, andListLogLogPlot, but is there a better way to do this with justListLinePlot? I guessScalingFunctionsis an (undocumented) option. – Daniel Weissman Mar 12 '15 at 01:00Joined -> Trueis the simplest method for the log plot functionality. – Mr.Wizard Mar 13 '15 at 05:36