5

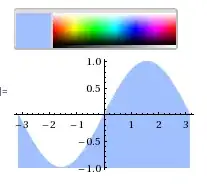
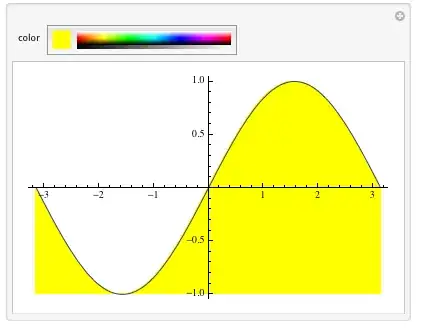
I am new to Mathematica and want to change the FillingStyle Dynamically in this Plot. I want that when I pick a color from the "Color" then, it should dynamically change in the Sin plot.

 a = RGBColor[1, 2, 0]
 Row[{Button["<<Color>>", a = SystemDialogInput["Color"]], 
Evaluate[Plot[Sin[m], {m, -Pi, Pi}, Filling -> Bottom, 
FillingStyle -> Dynamic[a]]]}]

I am able to pick a color but the plot is not changing dynamically. But, it changes when I am executing it again.

VividD
  • 3,660
  • 4
  • 26
  • 42
subbu
  • 2,304
  • 1
  • 13
  • 32

4 Answers4

11

The expression FillingStyle -> value is not preserved in the output Graphics expression of Plot, therefore it cannot be changed after-the-fact in that fashion. Instead you need to regenerate the plot when the value of a changes, meaning that Dynamic needs to surround Plot:

a = RGBColor[1, 2, 0]
Row[{Button["<<Color>>", a = SystemDialogInput["Color"]], 
  Dynamic @ Plot[Sin[m], {m, -Pi, Pi}, Filling -> Bottom, FillingStyle -> a]}]

Mathematica graphics

Mr.Wizard
  • 271,378
  • 34
  • 587
  • 1,371
8

In case someone with a possibly slow to generate plot want to do this it is possible without recalculating the plot.

Looking at the GraphicsComplex part of the plot:

p = Plot[Sin[m], {m, -Pi, Pi}, Filling -> Bottom, FillingStyle -> Blue];
p[[1]]
(* GraphicsComplex[{{-3.14159, -1.28228*10^-7}, ... }}, ..., RGBColor[0, 0, 1]...] *)

One can guess that the RGBColor part is replaceable

a = RGBColor[0, 0, 1];
p = Plot[Sin[m], {m, -Pi, Pi}, Filling -> Bottom, 
   FillingStyle -> a]/.a->Dynamic[a];

Row[{Button["<<Color>>", a = SystemDialogInput["Color"]], 
  p}]

plot

Looks a bit odd with the blue line so lets change PlotStyle as well. Note that even with a very slow function the plot can be regenerated instantly:

c = RGBColor[0, 0, 1];(*Initial color*)
p = Plot[Pause[0.01]; Sin[m], {m, -Pi, Pi}, Filling -> Bottom, 
   FillingStyle -> c, PlotStyle -> c] /. c -> Dynamic[c];

Column[{ColorSlider[Dynamic[c]], p}]

enter image description here

ssch
  • 16,590
  • 2
  • 53
  • 88
7

Or you could just use Manipulate:

Manipulate[
   Plot[Sin[m], {m,-Pi,Pi}, Filling -> Bottom, FillingStyle->color],
  {color,RGBColor[1,2,0]}]

enter image description here

halmir
  • 15,082
  • 37
  • 53
5

PaneSelector

 Column[{PaneSelector[{False -> 
   Panel[Style["filling color...", "Subsection", FontColor -> Dynamic[color]]], 
   True -> ColorSlider[Dynamic[color],  AppearanceElements -> "SwatchSpectrum"]},
   Dynamic[CurrentValue["MouseOver"]]],
 Dynamic@Plot[ x Cos[x], {x, -2 Pi, 2 Pi}, ImageSize -> 500,
    Filling -> Axis,  FillingStyle -> color]}]

enter image description here

Overlay

Dynamic@Overlay[{PaneSelector[{False -> 
      Plot[x Cos[x], {x, -2 Pi, 2 Pi}, ImageSize -> 500, 
       Filling -> Axis, FillingStyle -> color], 
     True -> ColorSlider[Dynamic@color, AppearanceElements -> "SwatchSpectrum"]}, 
    CurrentValue["MouseOver"]], 
   Plot[x Cos[x], {x, -2 Pi, 2 Pi}, ImageSize -> 500, Filling -> Axis,
     FillingStyle -> color]}, All, 1]

enter image description here

kglr
  • 394,356
  • 18
  • 477
  • 896
  • I answered this question in the most simple way possible (feeling that was probably most helpful to the author) and never returned to it. Nice to see that others took it deeper, even if I only notice now. – Mr.Wizard May 30 '15 at 17:40