16

I have the outline of a 2D shape defined by a periodic radius R[θ]. I would like to extrude this linearly to a prismatic 3D object that has my cross-sectional shape. I could extrude the outline, as shown below, but I need it to be filled, or at least capped. It would have been nice if I could use the Tube Graphics3D option and specify the radius as a function of theta. There must be a simple way to do this. Any suggestions ?

shape = PolarPlot[R[θ], {θ, 0, 2 π}, Axes -> False,
     PlotStyle -> {Black, Thickness[0.02]}]

shape3d = ParametricPlot3D[{R6[θ] Cos[θ], R6[θ] Sin[θ], z}, {θ, 0, 2 π}, {z, -2, 5}, 
     Axes -> False, Boxed -> False, Mesh -> None] 

my shape

J. M.'s missing motivation
  • 124,525
  • 11
  • 401
  • 574
user27949
  • 163
  • 4
  • 2
    See if this is what you would like: http://mathematica.stackexchange.com/questions/55847/extrude-2d-cross-section-to-3d-shape-with-shrinkfactor – Michael E2 Apr 21 '15 at 21:11

4 Answers4

18

Michael Seifert's answer is the easiest for curves that can be plotted parametrically, but there is a slightly more general method that can be used to construct an extrusion of any curve that can be plotted in 2D.

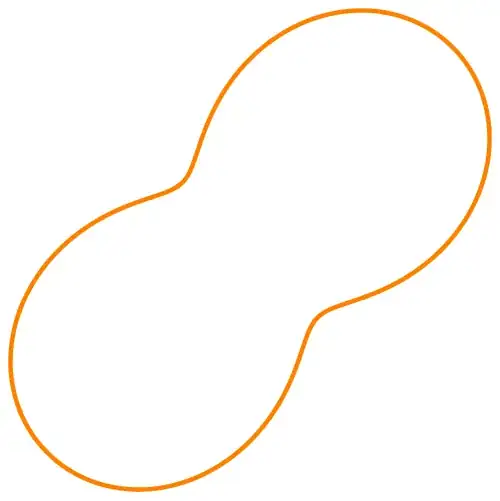
First, note that one can always extract the points from a 2D plotted curve, because Mathematica never forgets. For instance, with the curve provided in the question:

R[θ_] := (1 + 0.5 Sin[2 θ]);
shape1 = PolarPlot[R[θ], {θ, 0, 2 π}, 
  Axes -> False, 
  PlotStyle -> {Orange, Thickness[0.02]}
 ];

the points are located via

points = (Flatten @ shape1[[1]])[[2, 1]]

Other information about the curve can be found similarly, and using that info and list manipulations, we can use Polygons to construct a surface. Here is an extrusion function that does what is necessary:

Options[Extrude] = Join[Options[Graphics3D], {Closed -> True, Capped -> True}];

Extrude[curve_, {zmin_, zmax_}, opts : OptionsPattern[]] := 
  Module[{info, points, color, tube, caps},
   info = Flatten @ {curve[[1]]};
   points = Select[info, Head[#] === Line &][[1, 1]];
   If[OptionValue[Closed], points = points ~Join~ {points[[1]]}];
   color = Select[info, Head[#] === Directive &];
   If[Length[color] == 0, color = Orange, color = First @ Select[color[[1]], ColorQ]];

   tube = Polygon[
     Partition[
      Flatten[
       Transpose[points /. {x_, y_} -> {x, y, #} & /@ {zmin, zmax}], 1], 3, 1]
    ];

   If[OptionValue[Closed] && OptionValue[Capped],
    caps = Polygon[points /. {x_, y_} -> {x, y, #}] & /@ {zmin, zmax};
    tube = Flatten@{tube, caps},
    tube = {tube}
   ];

   Graphics3D[
    Flatten @ {EdgeForm[None], color, #} & /@ tube,
    FilterRules[{opts}, Options[Graphics3D]]
   ]
  ];

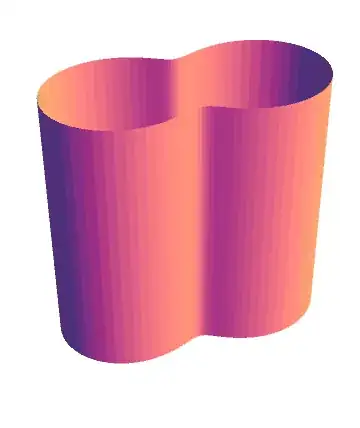
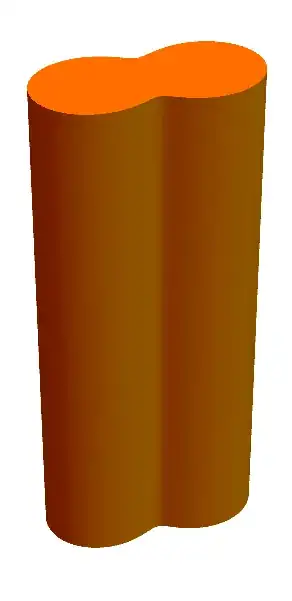
For the case in hand, we get

Extrude[shape1, {-2, 5}, Boxed -> False]

shape1 ext1

This is really a lot of work for the same result that Michael's answer gives more easily, but we can use this to close and extrude any plotted 2D curve:

shape2 = Plot[x^2, {x, -2, 2}, Axes -> False]
Extrude[shape2, {-2, 5}, Boxed -> False]

shape2 ext2

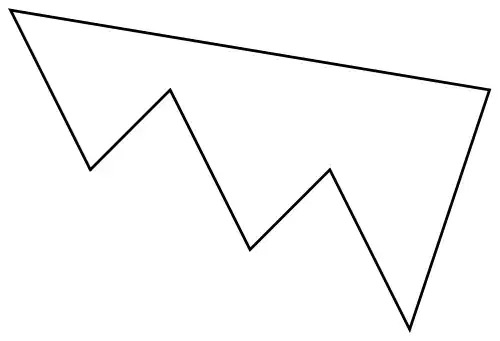
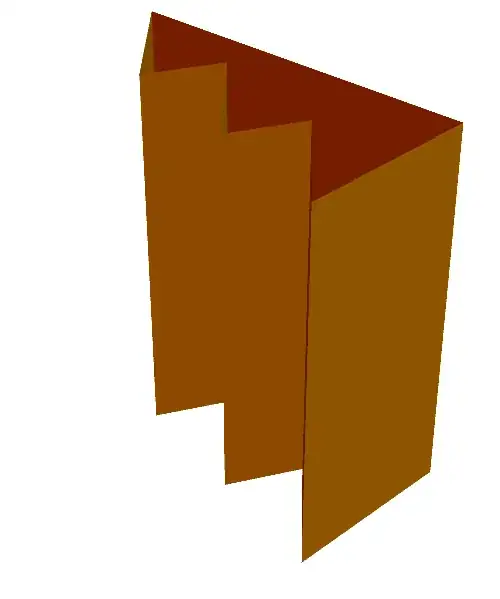
This will not work with Graphics primitives, as they do not provide a list of points that can be extracted (well, it will work with a Graphics[Line[...]]). Also, to close a non-closed shape, it simply connects the first and last points, which might not be the behavior always desired. Lastly, note that one can leave the caps off:

shape3 = Graphics[
  Line[{{0, 0}, {1, 1}, {2, -1}, {3, 0}, {4, -2}, {5, 1}, {-1, 2}, {0, 0}}]]
Extrude[shape3, {-2, 5}, Capped -> False, Boxed -> False]

shape3 ext3

J. M.'s missing motivation
  • 124,525
  • 11
  • 401
  • 574
Virgil
  • 3,437
  • 16
  • 27
15

You could create parametric plots for the endcaps as well:

tube = ParametricPlot3D[{R6[θ] Cos[θ], R6[θ] Sin[θ], z}, {θ, 0, 2 π}, {z, -2, 5},
                        Axes -> False, Boxed -> False, Mesh -> None]
endcap1 = ParametricPlot3D[{r R6[θ] Cos[θ], r R6[θ] Sin[θ], 5}, {θ, 0, 2 π}, {r, 0, 1},
                           Mesh -> False];
endcap2 = ParametricPlot3D[{r R6[θ] Cos[θ], r R6[θ] Sin[θ], -2}, {θ, 0, 2 π}, {r, 0, 1},
                           Mesh -> False];
Show[tube, endcap1, endcap2]

Weird tube with endcaps

J. M.'s missing motivation
  • 124,525
  • 11
  • 401
  • 574
Michael Seifert
  • 15,208
  • 31
  • 68
6

This answer was written to demonstrate that you can use BSplineSurface[] to render custom prisms, so that you won't need to carry as many polygons around as the other answers. To wit,

(* Lee's method, http://dx.doi.org/10.1016/0010-4485(89)90003-1 *)
parametrizeCurve[pts_List, a : (_?NumericQ) : 1/2] := 
    FoldList[Plus, 0, Normalize[(Norm /@ Differences[pts])^a, Total]] /;
    MatrixQ[pts, NumericQ]

shape1 = First[Cases[Normal[PolarPlot[1 + 0.5 Sin[2 θ], {θ, 0, 2 π},
                                      MaxRecursion -> 1, PlotPoints -> 45]],
                     Line[l_] :> l, ∞]];

tvals = parametrizeCurve[shape1, 1]; (* chord-length parametrization *)
knots = Join[{0, 0}, ArrayPad[tvals, -1], {1, 1}];
{zmin, zmax} = {-1, 2};
prispts = Outer[Append, shape1, {zmin, zmax}, 1];

Graphics3D[{EdgeForm[], Polygon[Transpose[prispts]],
            BSplineSurface[prispts,
                           SplineDegree -> 1, SplineKnots -> {knots, {0, 0, 1, 1}}]},
           Boxed -> False]

custom prism

Of course, you can omit the Polygon[] caps:

capless custom prism

J. M.'s missing motivation
  • 124,525
  • 11
  • 401
  • 574
4

We can use ArrayMesh to get your curve in 2D, then use RegionProduct to extrude in 3D.

raw = ImageTake[Import["https://i.stack.imgur.com/OCn1v.png"], {1, 250}];
im = Binarize[FillingTransform[ColorNegate[raw]]];

RegionProduct[RegionBoundary[ArrayMesh[ImageData[im]]], Line[{{0.}, {1000.}}]]

enter image description here

Update

In Version 11, we can use ImageMesh to lower the MeshCellCount:

raw = ImageTake[Import["https://i.stack.imgur.com/OCn1v.png"], {1, 250}];
im = FillingTransform[ColorNegate[raw]];

reg = RegionProduct[RegionBoundary[ImageMesh[im]], Line[{{0.}, {1000.}}]]

enter image description here

MeshCellCount[reg]
{128, 192, 64}
Greg Hurst
  • 35,921
  • 1
  • 90
  • 136