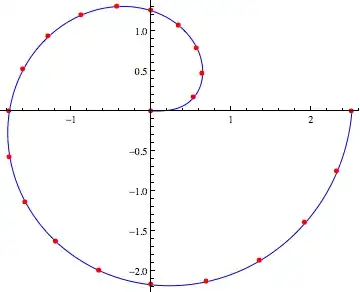
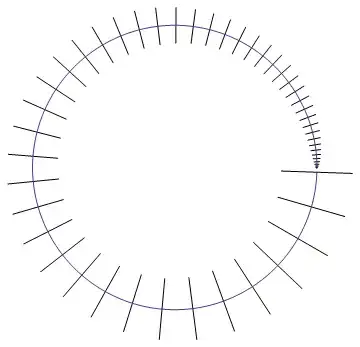
I have a parametric plot showing a path of an object in x and y (position), where each is a function of t (time), on which I would like to put a time tick, every second let's say. This would be to indicate where the object is moving fast (widely spaced ticks) or slow (closely spaced ticks). Each tick would just be short line that crosses the plot at that point in time, where that short line is normal to the plotted curve at that location.
I'm sure I can figure out a way to do it using lots of calculations and graphics primitives, but I'm wondering if there is something built-in that I have missed in the documentation that would make this easier.
(Note: this is about ticks on the plotted curve itself -- this doesn't have anything to do with the ticks on the axes or frame.)

 "
"
Mesh -> 50– wxffles Jul 24 '12 at 23:03Meshgets close to what I want. If the parametric plot range is{t,a,b}, then it appears I can useMesh->Round[(b-a)/10]to get dots every 10 seconds. (Obviously it works best ifb-ais a multiple of 10.) Now I need to figure out how to turn those into perpendicular line segments. I see that I can set Mesh to a list of tick locations each with a graphics directive ... – Mark Adler Jul 24 '12 at 23:15