In Mathematica 10, when I plot data that has small changes around some non-zero value, the plot chooses a PlotRange that "collapses" the data so that the variations cannot be seen. The only way I can find to reproduce the results seen in prior versions is to manually set the PlotRange. Is this a bug? Is there a way to redefine the function that computes PlotRange?
Here is a simple example of the problem I have.
dat = {{7.36107564302725094634299*^-8,6.49517319445169858694755},
{1.872486493499905555253878*^-7,6.495173287782000920228519},
{3.295280057690389061023151*^-7,6.495173324963207553515714},
{4.742955045429201620632748*^-7,6.495173299191079237788739},
{5.950099990519129421821797*^-7,6.495173215270764724855183},
{6.695807917858125246686823*^-7,6.495173088580509534386944},
{6.843647194344045088159516*^-7,6.495172942307050194820725}};
ylim = {Min[#], Max[#]} &[#[[2]] & /@ dat]
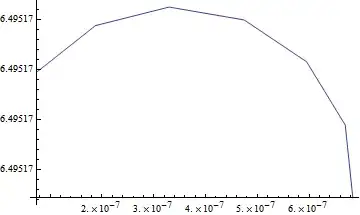
ListLinePlot[dat, PlotRange -> All]

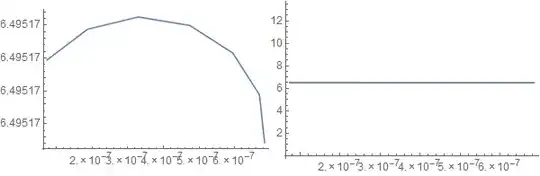
ListLinePlot[dat, PlotRange -> {All, ylim}]

In Mathematica version 9
ListLinePlot[dat, PlotRange -> All]