Here is an approach using the pst-solides3d package. In comparison to the approach using tikz-3dplot, it produces in a CAD-like manner a real solid, not just 6 single faces combined to a non-closed surface. Moreover it provides a light source and shading.
Note: the code must be compiled with XeLaTeX.
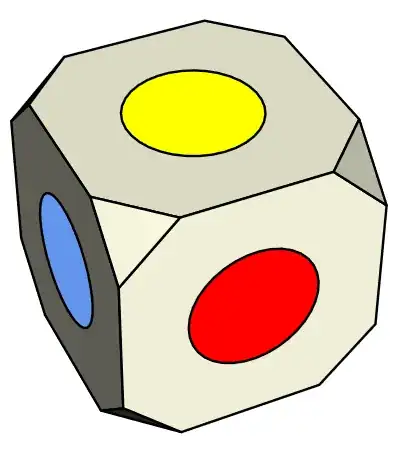
Chamfered edges
With viewpoint=x y z you can change the point of view of the output, trunccoeff=... controls the size of the chamfers.
\documentclass{standalone}
\usepackage[svgnames]{pstricks}
\usepackage{pst-solides3d}
\begin{document}
\psset{viewpoint=50 65 40 rtp2xyz, Decran=40, lightsrc=viewpoint, lightintensity=1.5}
\begin{pspicture}(-2.5,-2.75)(2.5,2.75)
\psset{unit=0.5}
\psset{solidmemory}
\psSolid[object=cube, a=8, action=draw**, trunccoeff=.22, trunc=all, name=dice, linecolor=black, fillcolor=Beige]
% define planes to draw circles on
\psSolid[object=plan, action=none, definition=solidface, args=dice 0, name=plane0]
\psSolid[object=plan, action=none, definition=solidface, args=dice 4, name=plane1]
\psSolid[object=plan, action=none, definition=solidface, args=dice 1, name=plane2]
% draw yellow circle
\psset{plan=plane0}
\psProjectionobject=point, action=none, name=yellowPoint
\psProjection[object=cercle, args=yellowPoint 2, linecolor=black, fillstyle=solid, fillcolor=Yellow]
% draw blue circle
\psset{plan=plane1}
\psProjectionobject=point, name=bluePoint, action=none
\psProjection[object=cercle, args=bluePoint 2, linecolor=black, fillstyle=solid, fillcolor=CornflowerBlue]
% draw red circle
\psset{plan=plane2}
\psProjectionobject=point, action=none, name=redPoint
\psProjection[object=cercle, args=redPoint 2, linecolor=black, fillstyle=solid, fillcolor=Red]
\end{pspicture}
\end{document}
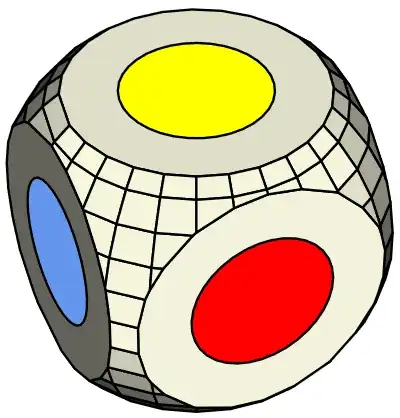
Round edges
Here is an addition to my first answer, implementing rounded edges instead of chamfered ones. It should be noted that pst3d-solides is based on a grid-based approach, which is where the facets come from. Their number can be adjusted via the variable ngrid=x y. The compile time increases strongly with increasing grid numbers.
\documentclass{standalone}
\usepackage[svgnames]{pstricks}
\usepackage{pst-solides3d}
\psset{viewpoint=50 65 40 rtp2xyz, Decran=30, lightsrc=viewpoint, lightintensity=1.5}
\begin{document}
\begin{pspicture}(-2.0,-2.5)(2.5,2.5)
\psset{solidmemory, fillcolor=Beige, lightsrc=viewpoint}
\codejps{/coeff 0.75 def /rO 4 def /OH coeff rO mul neg def}
% create sphere object and cut with planes for each side of the dice
\psSolid[object=sphere, r=rO, ngrid=18 27, plansepare={[1 0 0 OH]}, name=sphere, action=none]
\psSolid[object=load, load=sphere1, plansepare={[-1 0 0 OH]}, action=none, name=sphere]
\psSolid[object=load, load=sphere1, plansepare={[0 1 0 OH]}, action=none, name=sphere]
\psSolid[object=load, load=sphere1, plansepare={[0 -1 0 OH]}, action=none, name=sphere]
\psSolid[object=load, load=sphere1, plansepare={[0 0 1 OH]}, action=none, name=sphere]
\psSolid[object=load, load=sphere1, plansepare={[0 0 -1 OH]}, action=none, name=sphere]
\psSolidobject=load, load=sphere1, name=dice
% define planes to draw circles on
\psSolid[object=plan, definition=equation, args={[1 0 0 OH] 90}, action=none, name=plane0]
\psSolid[object=plan, definition=equation, args={[0 0 1 OH] 90}, action=none, name=plane1]
\psSolid[object=plan, definition=equation, args={[0 1 0 OH] 90}, action=none, name=plane2]
% draw blue circle
\psset{plan=plane0}
\psProjectionobject=point, action=none, name=yellowPoint
\psProjection[object=cercle, args=yellowPoint 1.5, linecolor=black, fillstyle=solid, fillcolor=CornflowerBlue]
% draw yellow circle
\psset{plan=plane1}
\psProjectionobject=point, name=bluePoint, action=none
\psProjection[object=cercle, args=bluePoint 1.5, linecolor=black, fillstyle=solid, fillcolor=Yellow]
% draw red circle
\psset{plan=plane2}
\psProjectionobject=point, action=none, name=redPoint
\psProjection[object=cercle, args=redPoint 1.5, linecolor=black, fillstyle=solid, fillcolor=Red]
\composeSolid
\end{pspicture}
\end{document}


r=sqrt(2)/2(assuming that the whole dice has size 1). Asymptote is a good way to go! – Black Mild Jan 10 '22 at 15:203D rounded corners– Black Mild Jan 11 '22 at 11:00