3
  • Goal: I want to rotate a complete 3D diagram (axes system) while keeping the "perceived size" constant.
  • My current version (see MWE) works in principle.
  • Problem: The problem is that the diagram "changes the size" all the time (it is "breathing" / "pumping").
  • Question: How can I keep the size constant (from a human point of view)?
  • I think I saw a related post some years ago but I did not find it.

\documentclass{article}

\usepackage{pgfplots} \pgfplotsset{compat=newest}

\usepackage{animate}

\begin{document}

\begin{animateinline}[controls]{20} \multiframe{200}{rAngle=25+1}{ \begin{tikzpicture} \begin{axis}[ view = {\rAngle}{30}, % <-- Rotate View scale only axis, unit vector ratio = 1 1 1, ] \addplot3[surf, mesh/rows=3] coordinates { (0,0,0) (1,0,0) (2,0,0) (3,0,0) (0,1,0) (1,1,0.6) (2,1,0.7) (3,1,0.5) (0,2,0) (1,2,0.7) (2,2,0.8) (3,2,0.5) }; \end{axis} \end{tikzpicture} } \end{animateinline}

\end{document}

enter image description here

enter image description here

enter image description here

  • 1
    How do you compile it and make an animation? (I have never done it). I think the same boundingbox for all frames solves the problem. (untested: \useasboundingbox (0,0) circle[radius=10cm];) – hpekristiansen Mar 23 '22 at 23:14
  • @hpekristiansen Just use pdflatex and make sure you view it in Adobe Reader. I tested your code, it is still "pumping" but thanks for the effort, – Dr. Manuel Kuehner Mar 23 '22 at 23:17

2 Answers2

5

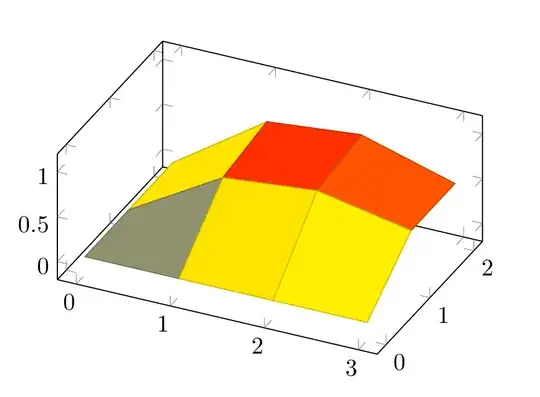
Tikz automatically computes the bounding box of the graphical elements in a picture which determines its overall final size. The size of the axis box projected on the canvas changes when viewed from different angles which results in the observed "pumping".

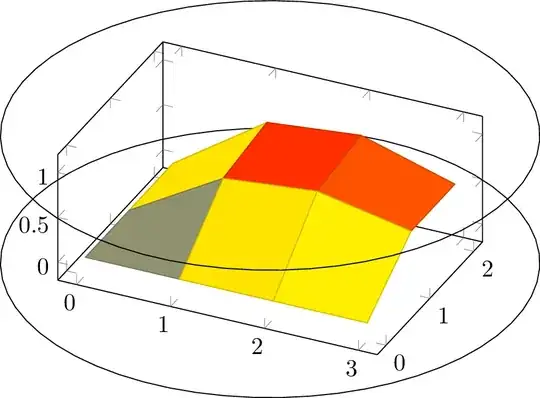
A way to work around this issue is to place a graphical object that does not change its 2d projection on the canvas when rotated and which encompasses all parts of the plot. Most suitable for this purpose is the bounding cylinder whose axis aligns with the rotation axis.

Bounding cylinder hidden (draw=none):

enter image description here

With cylinder shown:

enter image description here

\documentclass[export]{standalone}

\usepackage{pgfplots} \pgfplotsset{compat=newest}

\usepackage{animate}

\begin{document} %%%%%%%%%%%%%%%%%%%%%%%%%%%%%%%%%%%%%%%%%%%%%%%%%%%%%%%%%%%%%%%%%%%%%%%%%%%%%%%%% % fix axes to these ranges (depending on the data to be plotted, of course) \def\xmin{-0.2} \def\xmax{3.2} \def\ymin{-0.2} \def\ymax{2.2} \def\zmin{-0.2} \def\zmax{1.2} % bounding cylinder based on axes ranges with some scaling and z-offsets to also % include tick labels \def\scaleCylRadius{1.25} \pgfmathsetmacro\cylCentreX{0.5(\xmin+\xmax)} \pgfmathsetmacro\cylCentreY{0.5(\ymin+\ymax)} \pgfmathsetmacro\cylRadius{\scaleCylRadiussqrt((\xmax-\xmin)^2+(\ymax-\ymin)^2))/2} \pgfmathsetmacro\cylZMin{\zmin - 0.02} \pgfmathsetmacro\cylZMax{\zmax + 0.0} %%%%%%%%%%%%%%%%%%%%%%%%%%%%%%%%%%%%%%%%%%%%%%%%%%%%%%%%%%%%%%%%%%%%%%%%%%%%%%%%% \begin{animateinline}[controls]{20} \multiframe{60}{rAngle=25+6}{ \begin{tikzpicture} \begin{axis}[ view = {\rAngle}{30}, % <-- Rotate View unit vector ratio = 1 1 1, trig format plots=rad, xmin=\xmin,xmax=\xmax, ymin=\ymin,ymax=\ymax, zmin=\zmin,zmax=\zmax, clip=false, % don't clip cylinder circles to axes ranges ] % lower circle \addplot3[ draw=none, % comment out to see cylinder circles domain=0:2pi,samples=60]({\cylCentreX+\cylRadiussin(x)},{\cylCentreY+\cylRadiuscos(x)},\cylZMin); % data \addplot3[surf, mesh/rows=3] coordinates { (0,0,0) (1,0,0) (2,0,0) (3,0,0) (0,1,0) (1,1,0.6) (2,1,0.7) (3,1,0.5) (0,2,0) (1,2,0.7) (2,2,0.8) (3,2,0.5) }; % upper circle \addplot3 draw=none, domain=0:2*pi,samples=60; \end{axis} \end{tikzpicture} } \end{animateinline}

\end{document}

AlexG
  • 54,894
  • +1 Thanks! I will have a close look at it on Friday. – Dr. Manuel Kuehner Mar 24 '22 at 17:30
  • Quick update: I tried it and I do not yet fully understand the logic :). I might ask a clarification question soon. – Dr. Manuel Kuehner Mar 24 '22 at 20:44
  • 1
    The problem is that if I allow axes, they are automatically sized to also include the bounding cylinder, which in turn resizes the automatic TikZ bounding box which changes as a function of the view angle, finally bringing back the pumping behaviour. Only the bounding cylinder doesn't change its projected size on the canvas when viewed from different azimuthal angles and hence warrants a constant TikZ BBox. – AlexG Apr 07 '22 at 10:22
  • 1
    @Dr.ManuelKuehner I revisited my answer. Now it should be OK. – AlexG Apr 08 '22 at 05:08
  • Oh wow, thanks a lot. Now it is even better / clearer than before. – Dr. Manuel Kuehner Apr 08 '22 at 13:07
2

This made me remember: Parabolic Moebius map on sphere using tikz

Where @Fritz made an answer with a rotating coordinate system. I do not understand the code but maybe the defined viewport is used for exactly this!?

Here is my preliminary try:

\documentclass{article}
\usepackage{animate}
\usepackage{pgfplots}
\pgfplotsset{compat=1.18}
\tikzset{viewport/.style 2 args={
x={({cos(-#1)*1cm},{sin(-#1)*sin(#2)*1cm})},
y={({-sin(-#1)*1cm},{cos(-#1)*sin(#2)*1cm})},
z={(0,{cos(#2)*1cm})}
}}
\begin{document}
\begin{animateinline}[controls]{20}
\multiframe{200}{rAngle=25+1}{
\begin{tikzpicture}
\useasboundingbox (0,0) circle[radius=4];
\begin{axis}[
view = {\rAngle}{30},
disabledatascaling,  
anchor=origin,  
viewport={\rAngle}{30},
]
\addplot3[surf, mesh/rows=3] coordinates {
(0,0,0) (1,0,0) (2,0,0) (3,0,0)
(0,1,0) (1,1,0.6) (2,1,0.7) (3,1,0.5)
(0,2,0) (1,2,0.7) (2,2,0.8) (3,2,0.5)
};
\end{axis}
\end{tikzpicture}
}
\end{animateinline}
\end{document}

All frames on top of each other:

Multiple frames of surface plot interposed

Much more experimentation is needed and understanding the code.