This solution presents the approach you wanted with multiple files.
I split each data from each y column into a different file and removed some lines.
The main option is \addplot table {Fre\i.dat};. A MWE follows.
\documentclass{article}
\usepackage{tikz,pgfplots}
\usepackage{animate}
\usepackage{filecontents}
\begin{filecontents}{Fre1.dat}
0.0000000e+00 9.7322390e+00
2.5000000e+00 9.7404206e+00
5.0000000e+00 9.7651029e+00
7.5000000e+00 9.8067018e+00
1.0000000e+01 9.8659247e+00
1.2500000e+01 9.9437917e+00
1.5000000e+01 1.0041667e+01
1.7500000e+01 1.0161304e+01
2.0000000e+01 1.0304897e+01
2.2500000e+01 1.0475157e+01
\end{filecontents}
\begin{filecontents}{Fre2.dat}
0.0000000e+00 1.3985949e+01
2.5000000e+00 1.4001132e+01
5.0000000e+00 1.4046619e+01
7.5000000e+00 1.4122249e+01
1.0000000e+01 1.4227833e+01
1.2500000e+01 1.4363269e+01
1.5000000e+01 1.4528713e+01
1.7500000e+01 1.4724777e+01
2.0000000e+01 1.4952727e+01
2.2500000e+01 1.5214662e+01
\end{filecontents}
\begin{filecontents}{Fre3.dat}
0.0000000e+00 1.5525350e+01
2.5000000e+00 1.5546305e+01
5.0000000e+00 1.5609681e+01
7.5000000e+00 1.5717003e+01
1.0000000e+01 1.5870771e+01
1.2500000e+01 1.6074399e+01
1.5000000e+01 1.6332129e+01
1.7500000e+01 1.6648943e+01
2.0000000e+01 1.7030511e+01
2.2500000e+01 1.7483207e+01
\end{filecontents}
\begin{document}
\begin{tikzpicture}
\begin{axis}[scaled ticks=false,xmin=0,ymin=0, legend entries={$n=1$}, legend pos=north west, legend style = {font=\scriptsize}]
\addplot table {Fre1.dat};
\addplot table {Fre2.dat};
\addplot table {Fre3.dat};
\end{axis}
\end{tikzpicture}
\begin{animateinline}[controls,loop,bb=0 0 250 250]{1}
\multiframe{3}{i=1+1}{%
\begin{tikzpicture}
\begin{axis}[scaled ticks=false, xmin=0,ymin=0, xmax=30,ymax=20, legend entries={$n=\i$}, legend pos=north west, legend style = {font=\scriptsize}]
\addplot table {Fre\i.dat};
\end{axis}
\end{tikzpicture}
}
\end{animateinline}
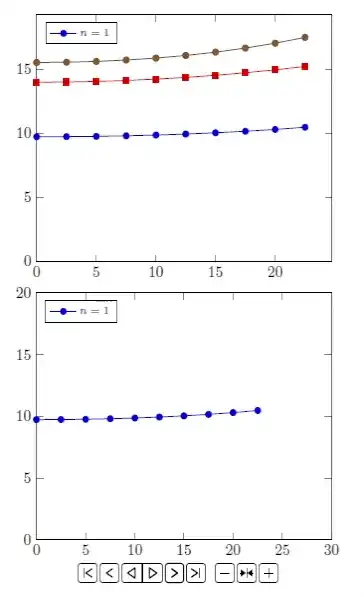
\end{document}
The animation is presented alongside the base graph.


standalone, I saw this and then I changed it to article. I also changed\iXto\ibut that's was not the cause. – FHZ Apr 29 '22 at 21:10animateinlineenvironment and add\def\iX{9}I don't get the error. – Dhruv Thakkar Apr 29 '22 at 21:15standalone. It seems to be some issue withymax=1. – FHZ Apr 29 '22 at 21:15