very interesting. I guess this is some unintended behavior because of how tabularray computes the center.
a really good fix is only possible by the author updating the package (or someone providing a patch, but then letting the author updating package is better)
in short, I think the cause is the following...
first, to center the array you need to put the content in a box, then measure the height and the depth of the box. But if you do just that, the baseline of a character with descender (e.g. y) will be above the baseline of a character without (e.g. a).
so, I'm not sure how tabularray implements the center alignment exactly (the source code is surely dense.), but experimentally this snippet:
\begin{tblr}{width=0.9\linewidth, colspec={X[m] X[2,m]}}
    {
        A line of text \\
        Some additional text \\
    } &
    {
    aa\includegraphics[width=\linewidth, height=0.3\linewidth]{example-image}
    \\
    bb\includegraphics[width=\linewidth, height=0.3\linewidth]{example-image}
}
\end{tblr}
gives the output
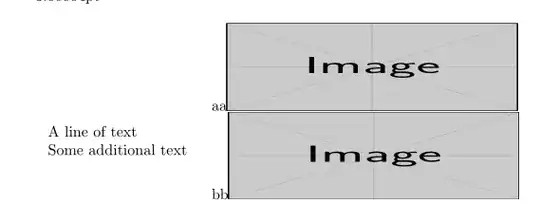
so I can guess that it takes the midpoint of (the top of a strut at the first line) and (the bottom of a strut at the last line).
in this case it appears that it might be better to take max(the top of the strut at the first line, the actual top of the first line) instead. Not sure if there's any case that this will give worse result than the current.
currently
\begin{tblr}{width=0.9\linewidth, colspec={X[m] X[2,m]}}
    some text & \rule{2pt}{15pt} other text with a tall column \rule{2pt}{15pt}
\end{tblr}
provides
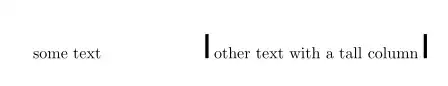
with the change, the baseline will no longer be aligned. Would that be desired...?
More practically, there are exceptionally tall inline formulas such as $5^{2^2}$, same issue. That having said this one in particular already skew the baselineskip whenever it's used so maybe that's not an issue...?
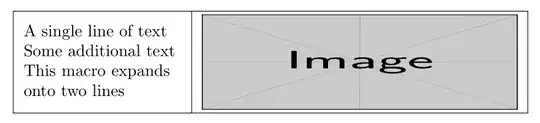
anyway, given the explanation of how I guess it works above, I can think of one workaround (which, if you understood the above, you should be able to understand why this one works as well).
\begin{tblr}{
        measure=vbox,
        width=0.9\linewidth,
        colspec={X[l,m] X[2,c,m]},
        hlines, vlines
    }
    {
        A single line of text \\
        Some additional text \\
        \mymacro
    } &
    {
        random text here \\
        \includegraphics[width=\linewidth, height=0.3\linewidth]{example-image} \\
        random text here
    }
\end{tblr}
the random text are only for demonstration. Replace with \strut or whatever invisible you want.
Disadvantage, this will only work if the first cell is taller than the second cell, which is unfortunately not the case here.
I come across https://tex.stackexchange.com/a/112977/250119 which mentions adjustbox package, thinking about it the midpoint of strut top (0.7\baselineskip) and the strut bottom (-0.3\baselineskip) is 0.2\baselineskip, so you can use m-type valign of adjustbox like this
\def\adjboxvcenter{0.2\baselineskip}
\begin{center}
\begin{tblr}{
        measure=vbox,
        width=0.9\linewidth,
        colspec={X[l,m] X[2,c,m]},
        hlines, vlines
    }
    {
        A single line of text \
        Some additional text \
        \mymacro
    } &
    \adjustbox{valign=m}{\includegraphics[width=\linewidth, height=0.3\linewidth]{example-image}}
\end{tblr}
\end{center}
if all of my guesses above are correct, this should be perfectly centered.
side note, instead of "assuming" the height, adjustbox (presumably) measure the height instead, so it's just a bit more convenient...
and yes, if you use m-type valign it might be simpler to just use tabular instead but • you need something-else to make multiple lines • \linewidth is the large linewidth, not the cell width:
    \begin{tabular}{ll}
        \adjustbox{valign=m}{\begin{tabular}{l}
                A single line of text \\
                Some additional text \\
                \mymacro
        \end{tabular}} &
        \adjustbox{valign=m}{\includegraphics[width=0.6\linewidth, height=0.2\linewidth]{example-image}}
    \end{tabular}


\raisebox{-0.5\height}{\includegraphics[width=\linewidth]{...}}– Ulrike Fischer Aug 09 '22 at 18:38