The file Map_of_USA_without_state_names.svgGFDL and CC-BY-SA, made by users Wapcaplet, Angr, Mahagaja and Techman224, contains the outline of Illinois in a vector format.
which we can simply extract from the source file.
It only consists of straight segments, though.
Once extracted, the path for Illinois can be included in TikZ via the svg.path library,
this is basically the same procedure as in
Regional map of Namibia on tikz.
To reference the corners of the outline, I'll setup a show path construction
decoration to declare a coordinate for every point on the path.
The rotation of −3.5 is found manually to rotate the map so that the north border is relatively horizontal.
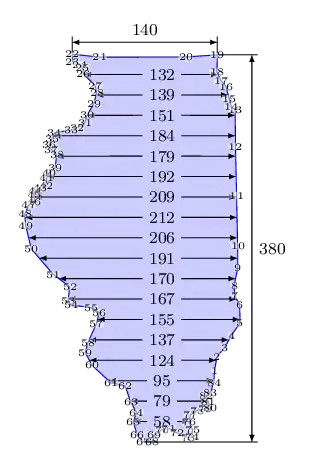
I've added a second image that shows the corners with their number labeled.
This is done by the commented loop.
Code
\documentclass[tikz,border=3mm]{standalone}
\usetikzlibrary{
arrows.meta,
calc,
svg.path,
intersections,
quotes,
decorations.pathreplacing}
\tikzset{
insert svg/.style={yscale=-1,insert path={\pgfextra\pgfpathsvg{#1}\endpgfextra}},
Illinois/.style={insert svg={M 189.27300,98.386000 L 189.27300,97.251000 L 189.42300,95.872000 L 190.11100,94.983000 L 190.65400,93.801000 L 191.44100,92.521000 L 191.29500,90.748000 L 190.75400,89.910000 L 190.65400,88.925000 L 190.90000,87.250000 L 190.75400,85.131000 L 190.35800,80.253000 L 189.96500,75.573000 L 189.71900,72.024000 L 189.32300,71.779000 L 189.07700,70.991000 L 188.68400,69.856000 L 188.19000,69.315000 L 187.74700,68.526000 L 187.67700,66.855000 L 184.65900,67.253000 L 176.36800,67.776000 L 173.72000,67.646000 L 173.78800,68.368000 L 174.48500,68.577000 L 174.76400,68.925000 L 174.90300,69.483000 L 176.08700,70.529000 L 176.29600,71.225000 L 176.08700,72.270000 L 175.53000,73.386000 L 175.32300,74.151000 L 174.62600,74.711000 L 174.06700,74.919000 L 172.46500,75.336000 L 172.25400,75.896000 L 172.04700,76.521000 L 172.25400,76.940000 L 172.81300,77.428000 L 172.74300,78.684000 L 172.18600,79.169000 L 171.97700,79.657000 L 171.97700,80.493000 L 171.42000,80.633000 L 170.93200,80.982000 L 170.86200,81.400000 L 170.93200,82.027000 L 170.40900,82.427000 L 170.09700,83.280000 L 170.23600,84.396000 L 170.93300,86.625000 L 173.16200,88.926000 L 174.83600,90.039000 L 174.76600,91.364000 L 175.04500,91.782000 L 176.99400,91.920000 L 177.83200,92.339000 L 177.62300,93.454000 L 176.92600,95.266000 L 176.71700,96.243000 L 177.41200,97.427000 L 179.36500,99.031000 L 180.75800,99.238000 L 181.38500,100.77100 L 182.01200,101.74800 L 181.73500,102.65400 L 182.22300,103.90800 L 182.77800,104.53500 L 183.68200,104.43100 L 183.85800,103.80600 L 184.54700,103.26500 L 185.18800,103.06800 L 186.02600,103.46300 L 187.11000,103.85800 L 187.45400,103.75800 L 187.50300,103.06900 L 187.11000,102.33100 L 187.20800,101.64000 L 187.80000,101.19700 L 188.58700,101.00200 L 189.07900,100.80500 L 188.83300,100.26200 L 188.63800,99.670000 L 188.98200,99.426000 L 189.27300,98.386000 z}}
}
\tikzset{
mark points/.style args={#1from#2named #3}{
decorate, /utils/exec=\gdef#1{#2}, decoration={show path construction,
moveto code={\xdef#1{\pgfinteval{#1+1}}%
\pgfcoordinate{#3-#1}{\pgfpointdecoratedinputsegmentfirst}},
lineto code={\xdef#1{\pgfinteval{#1+1}}%
\pgfcoordinate{#3-#1}{\pgfpointdecoratedinputsegmentlast}}}},
dim line distance/.initial=.2cm,
dim line style/.style={<->},
dim line delim/.style={-,shorten <=2\pgflinewidth,shorten >=-7\pgflinewidth},
dim line text/.style={midway,auto=left,font=\footnotesize},
pics/@dim line/.style n args={4}{code={\draw[dim line style]
($(#1)!\pgfkeysvalueof{/tikz/dim line distance}!90:(#2)$) coordinate(@1) to
node[dim line text,style/.expand once=\tikzpictextoptions]{$\tikzpictext$}
($(#2)!\pgfkeysvalueof{/tikz/dim line distance}!-90:(#1)$)coordinate(@2);
\draw[dim line delim] (#3) to (@1); \draw[dim line delim] (#4) to (@2);}},
pics/dim line/.style args={#1--#2}{@dim line={#1}{#2}{#1}{#2}},
pics/dim line vertical/.style args= {#1--#2 through #3}{
@dim line={{#1}-|{#3}}{{#2}-|{#3}}{#1}{#2}},
pics/dim line horizontal/.style args={#1--#2 through #3}{
@dim line={{#1}|-{#3}}{{#2}|-{#3}}{#1}{#2}}}
\begin{document}
\begin{tikzpicture}[scale=5, > = {Latex[scale=.7]}]
\draw[local bounding box=illinois, blue,
fill=blue!20, rotate=-3.5, Illinois, name path = illinois,
postaction={mark points=\illinoisCorners from -1 named illinois}];
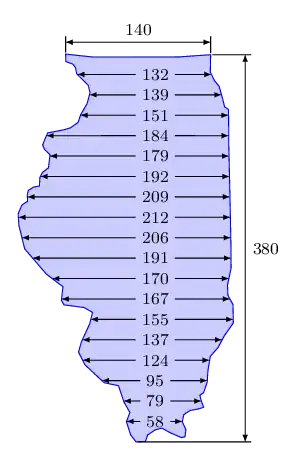
\foreach[count=\i] \n in {58, 79, 95, 124, 137, 155, 167, 170, 191,
206, 212, 209, 192, 179, 184, 151, 139, 132}{
\path[overlay] ($(illinois.south west)!\i/19!(illinois.north west)$)
-- ++(right:5) [name path=hor];
\path[name intersections={of=illinois and hor}]
node[node font=\footnotesize]
at ([xshift=1mm]intersection-1-|illinois.south) (node) {\n};
\draw[->] (node) edge (intersection-1) edge (intersection-2);
}
% \foreach \i in {1,...,\illinoisCorners} \node[fill=white, fill opacity=.5,
% text opacity=1, inner sep=0pt] at (illinois-\i) {\tiny\i};
\pic ["380"] {dim line vertical =
illinois-19--illinois-67 through illinois.east}
pic ["140"] {dim line horizontal=
illinois-22--illinois-19 through illinois.north};
\end{tikzpicture}
\end{document}
Output


