9

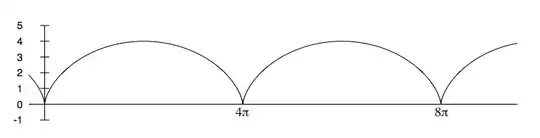
I know that the equations (t-sin t, 1-cos t) define a cycloid that looks like this: cycloid

However the code

\begin{tikzpicture}
\begin{axis}[title={Ciklois}, no markers]
\addplot[variable=\t, domain=0:360] ({t-sin(t)}, {1-cos(t)});
\end{axis}
\end{tikzpicture}

gives me this:

wrong cycloid

What's the problem? I know that gnuplot may help me out here, but I don't want to install it unless really necessary.

marczellm
  • 11,809

1 Answers1

9

You're doing a wrong calculation, consider making like this (the pgfplots is confused with degrees and radians so):

\addplot[variable=\t, domain=-2*pi:2*pi] ({t-sin(deg(t))}, {1-cos(deg(t))});

enter image description here

UPD: Updated with the comment of @ArTourter. That's a better solution.

m0nhawk
  • 9,664
  • 2
    probably a slightly easier code to use would be to use the deg function provided by pgfplots: t - sin(deg(t)) – ArTourter Dec 08 '12 at 16:01