9

I am a TeX/LaTeX noob, but I am learning rapidly. I am about to attempt to draw the following figure using LaTeX/TeX/TikZ I already have a, (I think) good working knowledge of how to draw circles, braces, lines, segments, and nodes, etc.

The last time I drew one though, I noticed that I spent a lot of time fine tuning parameters, making sure that lines intersected circles at the proper points, making sure lines were parallel, etc.

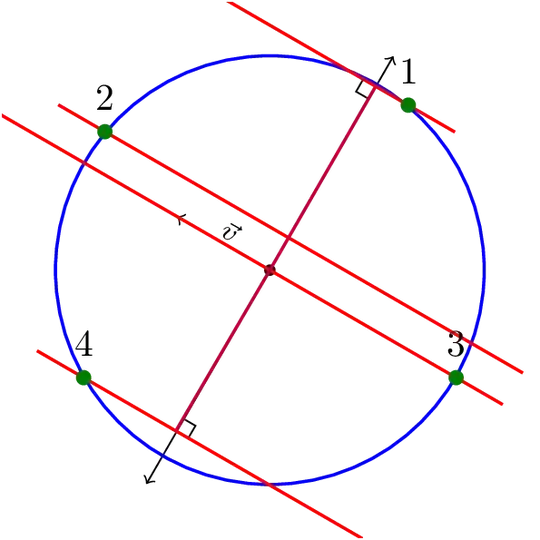
I need to draw the following figure, so I wanted first inquire if there is a fast/easy way, or anything I should keep in mind, when creating parallel lines (the red ones), as per the following figure:

enter image description here

The main time sinks I foresee are going to be the following:

  1. Making sure the length of the purple lines are exactly correct, so as not to overshoot the red ones.

  2. Making sure the red lines are all parallel to each other.

  3. Making sure than I can draw nodes/dots where lines intersect each other and/or the circle.

Is there any particular way(s) that is recommended to make sure that the above points do not waste too much time? I would appreciate any advice/examples.

Thanks!

P.S. I am making good use of TikZ as well.

EDIT:

I am including a minimal example of my 'skill' set. As you can see, I painstakingly usually just have to fine tune co-ordinates, for where things intersect, etc. I also do not know how to not-waste-time if I wanted to make parallel lines, as shown in the red lines above. Here is my example code:

\documentclass[journal]{IEEEtran}
\usepackage{graphicx}
\usepackage{float}
\usepackage{amsmath}
\usepackage{amsfonts}
\usepackage{tikz}
\usetikzlibrary{matrix}
\usetikzlibrary{decorations.pathreplacing}
\usepackage{xspace} 
\usepackage{float}
\usepackage{capt-of}
\usepackage{cases}


\begin{document}

\newcommand{\var}{1.5}

\begin{tikzpicture}
%\begin{tikzpicture}

    \draw [help lines] (-4,-4) grid (4,4);

    % Draw the axes
    \draw [->,black, ] (-4,0) -- (4,0) ;
    \draw [->,black] (0,-4) -- (0,4) ;

    % Draw the circle
    \path [draw, ultra thick,  black] (0,0) circle (3);

    %Radial Lines    
    \draw[black](0:0)--(45:3);
    \draw[black](0:0)--(135:3);
    \draw[black](0:0)--(225:3);
    \draw[black](0:0)--(315:3);        

    %Wavefront normal
    \draw[blue](0:0)--(60:3);
    \draw[blue](0:0)--(240:3);

    \draw[blue](0,1) arc (90:60:1);
    \draw[blue] (0,0.95)arc(90:60:0.95);
    \node[] at (75:1.2)  {$\alpha$};

    \draw[blue] (0.7,1.2)arc(90:30:0.37);
    %\node[] at (50:2) {$\frac{pi}{4}-\alpha$};
    \draw[-latex](1.5,3)node[right]{$\frac{\pi}{4}-\alpha$}
        to[out=180,in=90] (50:1.5);

    %Points
    \path[fill, black](45:3) circle(0.1);
    \node[] at (45:3.3){1};
    \path[fill, black](135:3) circle(0.1);
    \node[] at (133:3.3){4};
    \path[fill,black](225:3) circle(0.1);
    \node[] at (225:3.3){3};
    \path[fill, black](315:3) circle(0.1);
    \node[] at (313:3.3){2};

    %Wavefronts
    \draw[blue, ultra thick](-.5,3.6347)--(3.5,1.3252);
    \draw[blue, ultra thick](-2.5,2.34)--(3.5,-1.1242);
    \draw[blue, ultra thick](-3.2,0.9509)--(2.8,-2.5132);
    \draw[blue, ultra thick](-3.2,-1.4985)--(0.2,-3.4615);

    %Right angle signs
    \draw[red](60:2.8)--(62:2.8)--(62:2.9);
    \draw[red](60:.68)--(68:.69)--(67:.79);


    % Done
\end{tikzpicture}


\end{document}

The above code is now giving me this:

enter image description here

Spacey
  • 1,159
  • 1
    It would be helpful, to see a small MWE on how you define the circle and the lines. – Qrrbrbirlbel May 16 '13 at 21:13
  • @Qrrbrbirlbel Ok, I will work on it right now. – Spacey May 16 '13 at 21:13
  • There are at least two large packages that make doing this sort of thing easier: pstricks and tikz. They both have an initially steep learning curve. I don't do much work in tikz but I'd be more than happy to make suggestions of what to write for pstricks. – A.Ellett May 16 '13 at 21:18
  • I assumed you wanted to use TikZ because of the tag but now that @A.Ellett mentions it, you do not actually mention it in the question. – Qrrbrbirlbel May 16 '13 at 21:23
  • 1
    @Qrrbrbirlbel I have included a code snippet. Please see my edits. Yes, sorry, I also edited the question to make it clear I would like to use tikZ, if for no other reason than I this is what I have been learning with thus far. – Spacey May 16 '13 at 21:25
  • I added a preamble as well, saves other the trouble of doing that. – Torbjørn T. May 16 '13 at 22:17
  • @TyranaSaur Yeah, that looks like too much work. First and foremost, instead of multiplying every value with \var (which isn’t a bad idea), you could simply have used the scale key. Secondly, the values seem very arbitrary. Especially for specifying a point on a circle is very easy if you use the circle shape and one of its anchors (named or an arbitrary angle). Then, I see repetitive pairs of values, you should use coordinates in this case. Let me propose a rather different way. — Oh, and it totally looks different than your included image, huh … – Qrrbrbirlbel May 16 '13 at 22:32
  • @Qrrbrbirlbel Yeah, the code I have included is just the stepping stone I was going to use. :-) I didnt want to repeat my 'old' ways that are time consuming. – Spacey May 16 '13 at 22:49
  • Since you have some responses below that seem to answer your question, please consider marking one of them as ‘Accepted’ by clicking on the tickmark below their vote count (see How do you accept an answer?). This shows which answer helped you most, and it assigns reputation points to the author of the answer (and to you!). It's part of this site's idea to identify good questions and answers through upvotes and acceptance of answers. – Qrrbrbirlbel Sep 03 '13 at 17:56

3 Answers3

14

The first TikZ picture shows a rather sloppy idea to draw the parallel lines. The second example shows a more automatic way of drawing secants (one could have used the \angle value directly but I want do show how I’d do it, if the direction of the vector is not known to the user.

The second example also shows that calc’s ($(<p1>)!(<p3>)!(<p2>)$) isn’t very exact for close (<p1>) and (<p2>). Of course, there isn’t even a line when <p1> = <p2>.

The intersections library might be more precise in finding points where the orthogonal line to the vector and the secants intersect.

Code

\documentclass[tikz,convert=false]{standalone}
\usetikzlibrary{calc,through}
\tikzset{
  m*/.style args={#1:#2}{
    insert path={node [fill=green!50!black, outer sep=+0pt, shape=circle, inner sep=0pt, minimum size=+4pt,#1,label={#2}] {}}
  },
  m/.style={insert path={coordinate (#1)}},
  parLines/.style={draw=red,,shorten <=+-.5cm,shorten >=-.5cm},
  vertLines/.style={draw=purple,shorten >=.5\pgflinewidth},
  @splitLine/.code args={#1 -- #2}{\def\tikztotargetA{#1}\def\tikztotargetB{#2}},
  vert on/.style={
    to path={
      [@splitLine/.expanded={\tikztotarget}]
      -- ($(\tikztotargetA)!(\tikztostart)!(\tikztotargetB)$) node[right angle node,rotate=90*#1] {}\tikztonodes
    }
  },
  vert on/.default=0,
  right angle node/.style={
    at end,sloped,above,allow upside down,
    anchor=south east,
    shape=rectangle,
    inner sep=0pt,
    minimum size=3pt,
    append after command={
      \pgfextra\pgfinterruptpath\draw[right angle node path] (\tikzlastnode.south west) -- (\tikzlastnode.north west) -- (\tikzlastnode.north east);\endpgfinterruptpath\endpgfextra
    }
  },
  right angle node path/.style={draw,thin,black,-,shorten >=.4pt},
  secant/.style={
    to path={
      let \p{@dir}=(\tikztotarget), \n{@dir}={atan2(\x{@dir},\y{@dir})} in
      (node cs: name=\tikztostart, anchor=#1) [m*={name=m#1}:#1] -- (node cs: name=\tikztostart, anchor={2*(\n{@dir}-90)-#1}) [m=m#1'] \tikztonodes
    }
  }
}
\begin{document}
\begin{tikzpicture}[thick]
\clip (-2.5,-2.5) rectangle (2.5,2.5);
\draw[thin, ->] (0,0) [m*={black,minimum size=+3pt,name=O}:] -- node [sloped,above,inner sep=+1pt,font=\scriptsize] {$\vec v$} ++(150:1) coordinate (d);

\draw[thin, ->] (0,0) -- ([rotate=90]d)  [shorten >=-1.3cm];
\draw[thin, ->] (0,0) -- ([rotate=-90]d) [shorten >=-1.3cm];

\node [draw=blue, circle through={(2,0)}] (c) {};

\draw[parLines] (c.50)  [m*={name=m1}:1] -- ++([scale=2] d)    [m=m1'];
\draw[parLines] (c.140) [m*={name=m2}:2] -- ++([scale=-4] d)   [m=m2'];
\draw[parLines] (c.-30) [m*={name=m3}:3] -- ++([scale=4.5] d)  [m=m3'];
\draw[parLines] (c.210) [m*={name=m4}:4] -- ++([scale=-2.5] d) [m=m4'];

\draw[vertLines] (c.center) to[vert on] (m1 -- m1');
\draw[vertLines] (c.center) to[vert on] (m4' -- m4);
\end{tikzpicture}

\foreach \angle in {0,10,...,359}{% Careful, 36 pages!
\begin{tikzpicture}[thick]
\clip (-2.5,-2.5) rectangle (2.5,2.5);
\draw[thin, ->] (0,0) [m*={black,minimum size=+3pt,name=O}:] -- node [sloped,above,inner sep=+1pt,font=\scriptsize] {$\vec v$} ++(\angle:1) coordinate (d);

\draw[thin, ->] (0,0) -- ([rotate=90]d)  [shorten >=-1.3cm];
\draw[thin, ->] (0,0) -- ([rotate=-90]d) [shorten >=-1.3cm];

\node [draw=blue, circle through={(2,0)}] (c) {};

\draw[parLines] (c) to[secant=30]  (d);
\draw[parLines] (c) to[secant=140] (d);
\draw[parLines] (c) to[secant=-30] (d);
\draw[parLines] (c) to[secant=210] (d);


\draw[vertLines] (c.center) to[vert on] (m30 -- m30');
\draw[vertLines] (c.center) to[vert on] (m210' -- m210);
\end{tikzpicture}%
}
\end{document}

Output

enter image description here

enter image description here

Qrrbrbirlbel
  • 119,821
7

Solution with tkz-euclide, we get the parallel lines with

  \tkzDefLine[parallel=through B](a,A)     \tkzGetPoint{b} 

The new line goes through B and it's a parallel to Aa, we get a point b of this line.

 \documentclass{article}
 \usepackage{tkz-euclide}
 \usetkzobj{all}

 \begin{document}
 \begin{tikzpicture}
    % init the picture
    \tkzInit[xmin=-5,xmax=5,ymin=-5,ymax=5]
    \tkzGrid \tkzClip
    % definition of points  
    \tkzDefPoint(45:3){A}  
    % it was possible to use random points something like
    % \tkzGetRandPointOn[circle = center O radius 3 cm]{A}  
    \tkzDefPoint(0,0){O}
    \tkzDefPoint(135:3){B}  
    \tkzDefPoint(225:3){C}  
    \tkzDefPoint(315:3){D}  
     \tkzDefPoint(60:3){M} 
     \tkzDefPoint(240:3){N} 
    \tkzDefPoint(-1,4){a} 
    % definition of parallel lines
    \tkzDefLine[parallel=through B](a,A)     \tkzGetPoint{b}    
    \tkzDefLine[parallel=through C](a,A)     \tkzGetPoint{c}    
    \tkzDefLine[parallel=through D](a,A)     \tkzGetPoint{d}
    % orthogonal projection of O on the first line  
    \tkzDefPointBy[projection=onto A--a](O)  \tkzGetPoint{H}  
    % we can avoid the next line and use tkzInterLL 
    \tkzDefPointBy[projection=onto C--c](O)  \tkzGetPoint{K}     
    \tkzInterLL(K,H)(b,B)                    \tkzGetPoint{L}  
    % now we can draw         
    \tkzDrawCircle[R,thick](O,3 cm)
    \tkzDrawLines[add=1 and 1,color=blue](a,A B,b C,c)
    \tkzDrawLine[add=2 and 1,color=blue](D,d)   
     \tkzDrawSegments(A,C B,D)
    \tkzDrawLine[add=2 and 1,color=red](O,H)
     % mark right angles    
    \tkzMarkRightAngles[fill=lightgray](a,H,O C,K,O B,L,O)
     % draw points
    \tkzDrawPoints(A,B,C,D,O)
    % mark angles
     \tkzMarkAngle[mark= ,arc=ll,size=1 cm,mkcolor=blue](H,O,B)
     \tkzLabelAngle[pos=1.25](H,O,B){$\alpha$}
     \tkzMarkAngle[mark= ,arc=l,size=2.25 cm,mkcolor=blue](A,O,H)
     \tkzLabelAngle[pos=2.5,below=10pt](A,O,H){$\frac{\pi}{4}-\alpha$}
    % label points
     \tkzLabelPoint[right](A){$1$} \tkzLabelPoint[right](D){$4$}
     \tkzLabelPoint[above](B){$2$}  \tkzLabelPoint[below](C){$3$}
 \end{tikzpicture}
 \end{document}   

enter image description here

Alain Matthes
  • 95,075
  • Wow! Very nice - I see that you are able to make the intersections without defining actual points? – Spacey May 17 '13 at 17:30
4

Using PSTricks can be regarded as the best practice. The following code should be clear enough so the remaining is intentionally left as your homework.

enter image description here

\documentclass[pstricks,border=12pt]{standalone}
\usepackage{pst-eucl}
\psset{PointName=none,PointSymbol=none}

\begin{document}
\begin{pspicture}[showgrid](-3,-3)(3,3)
    \pnodes{O}(0,0)(2,0)
    \pstCircleOA{O0}{O1}
    \pnodes{P}(-3,3)(3,1)
    \pcline[nodesepA=1.5,nodesepB=.5](P0)(P1)
    \pstInterLC[PointSymbolB=*]{P0}{P1}{O0}{O1}{I0}{I2}
    \pstProjection{P0}{P1}{O0}
    \psline(O0)(O0')
    \pstRightAngle[RightAngleSize=0.15]{P0}{O0'}{O0}
    \pstTranslation[DistCoef=0.5]{O0'}{O0}{P0,P1}
    \pcline[nodesepA=1.5,nodesepB=.5](P0')(P1')
    \pstInterLC[PointSymbolA=*]{P0'}{P1'}{O0}{O1}{I0'}{I1'}
\end{pspicture}
\end{document}
  • Thanks ClickMe - I gravitated towards TikZ because I was introduced to it first, so why would you say that this PSTricks is better than TikZ? I would like to learn what advantages that might confer since I am new at this. Thanks! :-) – Spacey May 17 '13 at 17:31
  • PSTricks supports 3D much much much much much better than PGF/TikZ does. I invested my time in PSTricks just because of this reason. :-) – kiss my armpit May 17 '13 at 17:48