11

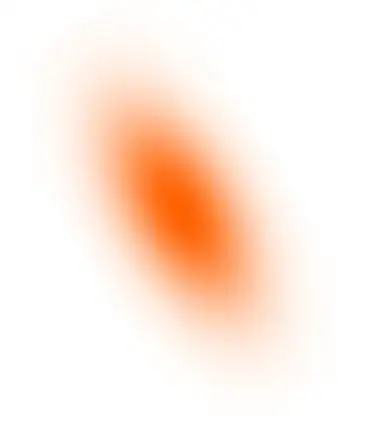
I'm trying to draw illustrations of Gaussian ellipsoids using shaded ellipses. In simple terms what I'm after is a way to have a light shade throughout the outer edge of the ellipse and a darker shade towards the centre of the ellipse (i.e the contours of a 2D Gaussian distribution should have the same shade proportional to the density). I've tried radial shading but it's not the effect I'm looking for.

Here is a simple example (which does not produce the shading result I want).

  \begin{tikzpicture}
    \def\particles{(20,-3),(22,-5),(22,-7),(19,-8) }
     \pgfsetfillopacity{0.6};

    \foreach \point in \particles{
      \shade[rotate around={30:\point},inner color=green] \point ellipse (1 and 2);         
      \draw[fill=black] \point circle (2mm);
    } 
  \end{tikzpicture}

enter image description here

Can anyone please suggest a method to draw the Gaussian ellipsoids?

sacworld
  • 113

2 Answers2

16

You can also use PGFPlots and adapt the approach from Draw a bivariate normal distribution in TikZ to draw gaussian ellipses. Note that this is much slower than John's approach.

\documentclass{standalone}

\usepackage{pgfplots}
\usepgfplotslibrary{patchplots}

\begin{document}

\pgfplotsset{
colormap={whitered}{color(0cm)=(white); color(1cm)=(orange!75!red)}
}

\begin{tikzpicture}[
    rotate=30,
    declare function={mu1=1;},
    declare function={mu2=2;},
    declare function={sigma1=0.5;},
    declare function={sigma2=1;},
    declare function={normal(\m,\s)=1/(2*\s*sqrt(pi))*exp(-(x-\m)^2/(2*\s^2));},
    declare function={bivar(\ma,\sa,\mb,\sb)=
        1/(2*pi*\sa*\sb) * exp(-((x-\ma)^2/\sa^2 + (y-\mb)^2/\sb^2))/2;}]
\begin{axis}[
    colormap name=whitered,
    width=15cm,
    view={0}{90},
    enlargelimits=false,
    domain=0:2,
    y domain=0:4,
    samples=17,
    axis equal image,
    hide axis,
]
\addplot3 [surf, draw=none, shader=interp, patch type=bilinear] {bivar(mu1,sigma1,mu2,sigma2)};
\end{axis}
\end{tikzpicture}
\end{document}
Jake
  • 232,450
  • Why it's so hard to add another addplot so as to have two normal distributions appearing? – Marion Jul 15 '21 at 08:44
  • Cannot reproduce the image with TeXLive 2023 pdfTeX 3.141592653-2.6-1.40.25, even with \pgfplotsset{compat=1.6}, as it complains. Upd: Wait, it works with Chromiums' PDF viewer, does not work with Preview.app. Not a LaTeX problem, hence. – Oleg Lobachev May 05 '23 at 15:41
12

What you could do is layer lots of ellipses on top of each other, each one a little bit smaller and darker than the previous one. This gives the illusion of a smooth gradient, providing there are enough ellipses. In the code below I'm using ten ellipses, but you can adjust that to your liking.

Code

\documentclass{article}
\usepackage{tikz}
\begin{document}
  \begin{tikzpicture}
    \def\particles{(20,-3),(22,-5),(22,-7),(19,-8) }

    \foreach \point in \particles{
      \foreach\i in {0,0.1,...,1} {
        \fill[opacity=\i,green,rotate around={30:\point}] \point ellipse ({1-\i} and {2-2*\i});         
      }
      \fill[black] \point circle (2mm);
    } 
  \end{tikzpicture}
\end{document}

Result

enter image description here


In the code below, I used 100 ellipses. I also adjusted the opacity by a factor of 0.02. There's no method to this, I just fiddled with the numbers until it looked "right".

\documentclass{article}
\usepackage{tikz}
\begin{document}
  \begin{tikzpicture}
    \def\particles{(20,-3),(22,-5),(22,-7),(19,-8) }
    \foreach \point in \particles{
      \foreach\i in {0,0.01,...,1} {
        \fill[opacity=\i*0.02,green,rotate around={30:\point}] \point ellipse ({1-\i} and {2-2*\i});         
      }
      \fill[black] \point circle (2mm);
    } 
  \end{tikzpicture}
\end{document}

enter image description here