I am plotting figures on GMT but it does not support some features in gridview. So I want stack each figure on different platforms below each other. E.g. I want to add each image like the following
I am plotting figures on GMT but it does not support some features in gridview. So I want stack each figure on different platforms below each other. E.g. I want to add each image like the following
I'll show you how to stack external files on top of one another in the manner you want, assuming you've got the ticks, axes labels and titles of the main square images in the external files. I used the file you linked in your comment for the bottom layer, and since there were no other ones (and the higher ones are different - no axes labels), I used some random images. My approach was to adjust this answer of a similar question. Here is the code:
\documentclass[tikz]{standalone}

\usetikzlibrary{calc,3d}

\begin{document}

\begin{tikzpicture}
% Layers
\begin{scope}[x={(-0.7cm,0.4cm)}, y={(.9cm,.2cm)}, z={(0cm,1cm)}]
\node[canvas is yx plane at z=0,transform shape] at (0,0) {\includegraphics[width=5cm]{isotropy3.pdf}};
\node[canvas is yx plane at z=2,transform shape] at (0,0) {\includegraphics[width=5cm]{kitten1.jpg}};
\node[canvas is yx plane at z=4,transform shape] at (0,0) {\includegraphics[width=5cm]{kitten2.jpg}};
\node[canvas is yx plane at z=6,transform shape] at (0,0) {\includegraphics[width=5cm]{kitten3.jpg}};
\end{scope}
% Legend
\node[draw,inner sep=.3pt,line width=2pt,anchor=south west] at (4.7,-1.2) {\includegraphics[width=3cm,height=.2cm]{gradient.jpg}};
\foreach \x\y in {0/-4,.24/-3,.48/-2,.72/-1,.96/0}{
  \draw[line width=1pt] (4.75+\x*3,-.92)--+(270:.45);
  \node[anchor=north] at (4.75+\x*3,-1.35) {$\mathsf\y$};
}
\node at (6.3,-2.2) {\sf dc/cprem (\%)};
\end{tikzpicture}

\end{document}
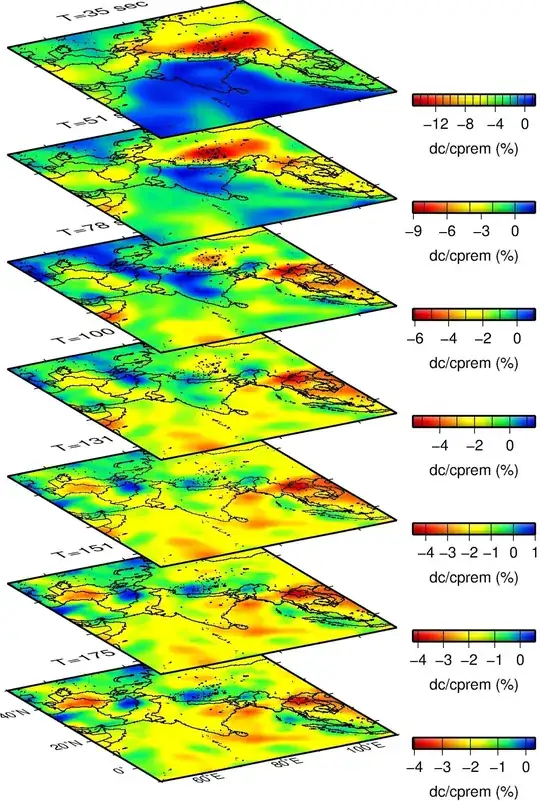
You can fiddle around with the arguments for the scope environment to change the projection of the images. I also included a little drawing of one of your legends using TikZ, in case you wanted to do that, using an external image (this one) for the gradient. Here is the result:

The bottom file is called isotropy.pdf, the one above it is kitten1.jpg, then kitten2.jpg, and finally kitten3,jpg on top, all of which are located in the same directory as your main .tex file.
standalone package here if your distribution doesn't have it. I'm assuming that you mean that the output has less quality, but I'm not sure what that exactly means. There is no compression of images done in the compiling, and if you want a larger image, simply change [width=5cm] to [width=10cm] or something larger.
– Jānis Lazovskis
Apr 20 '14 at 11:32
standalone and this is recommended. (Much less likely to cause issues than installing a downloaded copy manually.) But, as you discovered, you don't actually need it here.
– cfr
Aug 12 '16 at 11:54