I want to draw ribbon lines and to be able to control the crossings.
For instance
\documentclass{standalone}
\usepackage{tikz}
\begin{document}
 \begin{tikzpicture}
\clip (-1,-2) rectangle (2,2);
\draw [double,double distance=3pt]
plot [smooth cycle] coordinates{(-4,0) (0,0) (4,0)}
plot [smooth cycle] coordinates{(0,0) (0,1) (1,1) (1,-1) (0,-1)};
\end{tikzpicture}
\end{document}
produces the following:
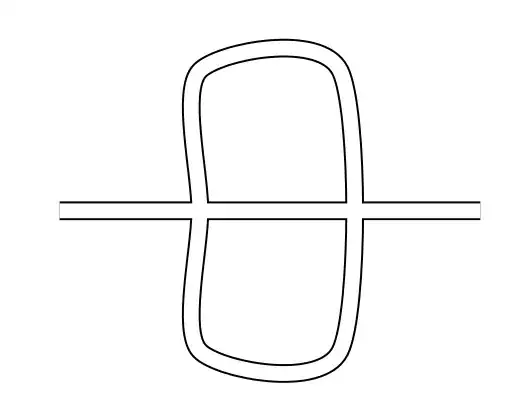
and what I'd like to have is:

(which I corrected manually).
Ideally (and eventually I'll need that) I'd like to be able to treat as nodes the figures like, say, these:

and

and be able to choose one of the four double lines and connect it with a double line of other node(s); so I'm sure my approach is not the best one. Any suggestions?


