I have some data stored to file, that I would like to plot with pgfplots. The data is stored row-wise, that is the file looks something like this:
a  1 2 3 4 5
b  6 7 8 9 0
c  2 4 6 8 0
...
Pgfplots expects the data to be column-wise, however. To solve this, I transpose the table using \pgfplotstabletranspose. This seems to have problems with the row titles, however.
The following minimal example shows what I have accomplished so far.
\documentclass{article}

\usepackage{pgfplots}
\usepackage{pgfplotstable}

\begin{document}

  \begin{tikzpicture}
    \begin{axis}
      \pgfplotstableread{
        x  1  2  3  4  5
        y  1  4  9 16 25
      }\datatable;
      \pgfplotstabletranspose\datatable{\datatable};

      \addplot table {\datatable};
    \end{axis}
  \end{tikzpicture}

\end{document}
The desired output is the following plot:
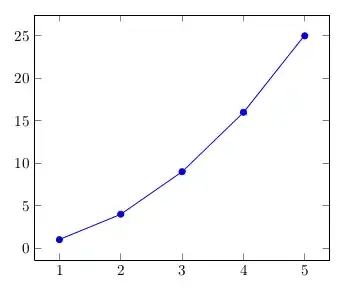
Unfortunately, I get the following error:
Package PGF Math Error: Could not parse input 'x' as a floating point number, sorry.
(Interestingly, when using -interaction=nonstopmode the plot is generated as desired nonetheless, but the error is annoying...)
Can I somehow tell pgfplots, that the first column contains the row titles to get rid of the error messages?
