116

Updated Below

I hope the title gets at what I'm trying to do. I have a large image for a thesis on an image processing topic, and I want show the large image, with zoomed in boxes (typically with the same aspect ratio). I also want colored frames overlaid on the large image to show what portions I'm magnifying. Here's an example:

enter image description here

I am currently accomplishing this by taking the large image and copying the desired zoomed areas into seperate images, and creating the overlaid frames, all in MATLAB. I then use the technique discussed in this previous question of mine to align all the images nicely.

My new question is, can a similar end product be created entirely within LaTeX so that the only external file I need is the original large image, and some LaTeX component (I'm thinking Tikz, but open to suggestions) creates the overlaid frames and cropped/ zoomed copies of it, then either arranges them as shown in my example, or uses the technique here to align them nicely.

Also, the example I showed is just a sample layout; ideally any solution would be flexible enough to allow rearrangement to some other reasonable arrangement, such as large image on top (full linewidth) with two or three zoom boxes in a horizontal line under it.

Thanks.

The image I'm working with is here:

Art Gallery

Update

Please see Jake's response below for current best/ complete version of code. The only outstanding item is that, while subcaptions work and can be referenced with \subref{}, the spy library processes the labels multiple times, resulting in a warning about multiply defined labels.

As such, I have elected to not use subcaptions/ labels for now since the color-coding makes pretty clear the relationship between the zoomed images and the large one. The subcaptions can be removed by replacing the line

\newcommand\phantomimage{\subcaptionbox{\label{\pgfkeysvalueof{/tikz/subfigurename}}}{\phantom{\rule{\imagewidth}{\imageheight}}}}

with

\newcommand\phantomimage{\phantom{\rule{\imagewidth}{\imageheight}}}

I've started a separate question here about the multiply-defined labels with spy problem. I'll update this post again if any solution comes out of the new question.

Final Update

The subcaption issue has been resolved. Please see Jake's response below for final code and usage.

Tobi
  • 56,353
SSilk
  • 3,732

4 Answers4

136

Here's an example of using the spy library that Martin mentioned. I've written a couple of styles that can be used to create an array of magnficiations, with an arbitrary number of rows and columns, placed on any side of the original image, with specifiable gaps. The magnifications will take up the same space as the original image.

The image itself and the magnifications are subcaptionboxes, which requires the subcaption package. They are assigned labels of the form <figurename>-image and <figurename>-zoom, and can be referenced using \ref and \subref. If no figurename is supplied as an option to the tikzpicture, a default name of zoombox will be assumed.

The center points of the magnifications are specified in relative coordinates: \zoombox{0,0} would zoom in on the lower left corner, \zoombox{1,1} on the upper right.

You can specify the zoom factor for the individual zoomboxes using the optional argument: \zoombox[magnification=5]{0.5,0.5} would zoom in on the middle of the image, magnifiying 5x.

Boxes and magnifications can be drawn with a coloured frame using the optional argument [color code=<color>].

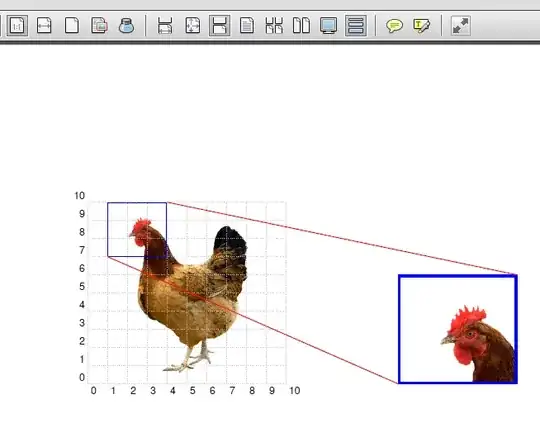
To display a grid over the original image to aid in placing the zoom points, use the option help grid in the image node.

Instead of using colors, black and white dash patterns can be used with the option black and white. This overrides color code options. To automatically use a different dash pattern for every box, use black and white=cycle.

Update Fixed an issue with the black and white pattern not being correctly initialised. Thanks, SSilk.

you would use

\begin{figure}\centering
\begin{tikzpicture}[zoomboxarray]
    \node [image node] { \includegraphics[width=0.45\textwidth]{gallery} };
    \zoombox{0.175,0.9}
    \zoombox[magnification=2]{0.7,0.6}
    \zoombox{0.15,0.3}
    \zoombox[magnification=10]{0.86,0.35}
\end{tikzpicture}
\caption{The National Gallery of Canada}
\end{figure}

The same example with colored outlines

\begin{tikzpicture}[zoomboxarray]
    \node [image node] { \includegraphics[width=0.45\textwidth]{gallery} };
    \zoombox[color code=red]{0.175,0.9}
    \zoombox[magnification=2,color code=yellow]{0.7,0.6}
    \zoombox[color code=orange]{0.15,0.3}
    \zoombox[magnification=10,color code=lime]{0.86,0.35}
\end{tikzpicture}

Displaying a grid over the original image:

\begin{tikzpicture}[zoomboxarray]
    \node [image node,help grid] { \includegraphics[width=0.45\textwidth]{gallery} };
    \zoombox[color code=red]{0.175,0.9}
    \zoombox[magnification=2,color code=yellow]{0.7,0.6}
    \zoombox[color code=orange]{0.15,0.3}
    \zoombox[magnification=10,color code=lime]{0.86,0.35}
\end{tikzpicture}

To get three magnifications in a horizontal row below the original image, like this

you would use

\begin{figure}[ht]\centering
\begin{tikzpicture}[zoomboxarray, zoomboxes below, zoomboxarray inner gap=0.5cm, zoomboxarray columns=3, zoomboxarray rows=1]
    \node [image node] { \includegraphics[width=0.45\textwidth]{gallery} };
    \zoombox[magnification=2]{0.175,0.72}
    \zoombox[magnification=2]{0.71,0.5}
    \zoombox[magnification=10]{0.86,0.38}
\end{tikzpicture}
\caption{The National Gallery of Canada}
\end{figure}

Using connect zoomboxes to draw connecting lines to link the zoomboxes to the point in the image, and also changing the line color and thickness using the zoombox paths style:

\begin{tikzpicture}[zoomboxarray,
    zoomboxes below,
    zoomboxarray columns=3,
    zoomboxarray rows=1,
    connect zoomboxes,
    zoombox paths/.append style={ultra thick, red}]
    \node [image node] { \includegraphics[width=0.45\textwidth]{gallery} };
    \zoombox[magnification=2]{0.175,0.72}
    \zoombox[magnification=2]{0.71,0.5}
    \zoombox[magnification=10]{0.86,0.38}
\end{tikzpicture}

Using black and white to draw the boxes as black and white dashed lines:

\begin{tikzpicture}[
    zoomboxarray,
    black and white
]
    \node [image node] { \includegraphics[width=0.45\textwidth]{gallery} };
    \zoombox{0.27,0.9}
    \zoombox[color code=red,magnification=6]{0.4,0.83}
    \zoombox{0.42,0.45}
    \zoombox[magnification=5]{0.95,0.52}
\end{tikzpicture}

Using black and white=cycle to draw each box with a different black and white dash pattern:

\begin{tikzpicture}[
    zoomboxarray,
    black and white=cycle
]
    \node [image node] { \includegraphics[width=0.45\textwidth]{gallery} };
    \zoombox{0.27,0.9}
    \zoombox[color code=red,magnification=6]{0.4,0.83}
    \zoombox{0.42,0.45}
    \zoombox[magnification=5]{0.95,0.52}
\end{tikzpicture}

Here's the complete code:

\documentclass{article}
\usepackage{graphicx}
\usepackage{caption}
\usepackage{subcaption}
\usepackage{tikz}
\usepackage{pgfplots}
\usetikzlibrary{spy,calc}
\usepackage{hyperref}


\newif\ifblackandwhitecycle
\gdef\patternnumber{0}

\pgfkeys{/tikz/.cd,
    zoombox paths/.style={
        draw=orange,
        very thick
    },
    black and white/.is choice,
    black and white/.default=static,
    black and white/static/.style={ 
        draw=white,   
        zoombox paths/.append style={
            draw=white,
            postaction={
                draw=black,
                loosely dashed
            }
        }
    },
    black and white/static/.code={
        \gdef\patternnumber{1}
    },
    black and white/cycle/.code={
        \blackandwhitecycletrue
        \gdef\patternnumber{1}
    },
    black and white pattern/.is choice,
    black and white pattern/0/.style={},
    black and white pattern/1/.style={    
            draw=white,
            postaction={
                draw=black,
                dash pattern=on 2pt off 2pt
            }
    },
    black and white pattern/2/.style={    
            draw=white,
            postaction={
                draw=black,
                dash pattern=on 4pt off 4pt
            }
    },
    black and white pattern/3/.style={    
            draw=white,
            postaction={
                draw=black,
                dash pattern=on 4pt off 4pt on 1pt off 4pt
            }
    },
    black and white pattern/4/.style={    
            draw=white,
            postaction={
                draw=black,
                dash pattern=on 4pt off 2pt on 2 pt off 2pt on 2 pt off 2pt
            }
    },
    zoomboxarray inner gap/.initial=5pt,
    zoomboxarray columns/.initial=2,
    zoomboxarray rows/.initial=2,
    subfigurename/.initial={},
    figurename/.initial={zoombox},
    zoomboxarray/.style={
        execute at begin picture={
            \begin{scope}[
                spy using outlines={%
                    zoombox paths,
                    width=\imagewidth / \pgfkeysvalueof{/tikz/zoomboxarray columns} - (\pgfkeysvalueof{/tikz/zoomboxarray columns} - 1) / \pgfkeysvalueof{/tikz/zoomboxarray columns} * \pgfkeysvalueof{/tikz/zoomboxarray inner gap} -\pgflinewidth,
                    height=\imageheight / \pgfkeysvalueof{/tikz/zoomboxarray rows} - (\pgfkeysvalueof{/tikz/zoomboxarray rows} - 1) / \pgfkeysvalueof{/tikz/zoomboxarray rows} * \pgfkeysvalueof{/tikz/zoomboxarray inner gap}-\pgflinewidth,
                    magnification=3,
                    every spy on node/.style={
                        zoombox paths
                    },
                    every spy in node/.style={
                        zoombox paths
                    }
                }
            ]
        },
        execute at end picture={
            \end{scope}
            \node at (image.north) [anchor=north,inner sep=0pt] {\subcaptionbox{\label{\pgfkeysvalueof{/tikz/figurename}-image}}{\phantomimage}};
            \node at (zoomboxes container.north) [anchor=north,inner sep=0pt] {\subcaptionbox{\label{\pgfkeysvalueof{/tikz/figurename}-zoom}}{\phantomimage}};
     \gdef\patternnumber{0}
        },
        spymargin/.initial=0.5em,
        zoomboxes xshift/.initial=1,
        zoomboxes right/.code=\pgfkeys{/tikz/zoomboxes xshift=1},
        zoomboxes left/.code=\pgfkeys{/tikz/zoomboxes xshift=-1},
        zoomboxes yshift/.initial=0,
        zoomboxes above/.code={
            \pgfkeys{/tikz/zoomboxes yshift=1},
            \pgfkeys{/tikz/zoomboxes xshift=0}
        },
        zoomboxes below/.code={
            \pgfkeys{/tikz/zoomboxes yshift=-1},
            \pgfkeys{/tikz/zoomboxes xshift=0}
        },
        caption margin/.initial=4ex,
    },
    adjust caption spacing/.code={},
    image container/.style={
        inner sep=0pt,
        at=(image.north),
        anchor=north,
        adjust caption spacing
    },
    zoomboxes container/.style={
        inner sep=0pt,
        at=(image.north),
        anchor=north,
        name=zoomboxes container,
        xshift=\pgfkeysvalueof{/tikz/zoomboxes xshift}*(\imagewidth+\pgfkeysvalueof{/tikz/spymargin}),
        yshift=\pgfkeysvalueof{/tikz/zoomboxes yshift}*(\imageheight+\pgfkeysvalueof{/tikz/spymargin}+\pgfkeysvalueof{/tikz/caption margin}),
        adjust caption spacing
    },
    calculate dimensions/.code={
        \pgfpointdiff{\pgfpointanchor{image}{south west} }{\pgfpointanchor{image}{north east} }
        \pgfgetlastxy{\imagewidth}{\imageheight}
        \global\let\imagewidth=\imagewidth
        \global\let\imageheight=\imageheight
        \gdef\columncount{1}
        \gdef\rowcount{1}
        \gdef\zoomboxcount{1}
    },
    image node/.style={
        inner sep=0pt,
        name=image,
        anchor=south west,
        append after command={
            [calculate dimensions]
            node [image container,subfigurename=\pgfkeysvalueof{/tikz/figurename}-image] {\phantomimage}
            node [zoomboxes container,subfigurename=\pgfkeysvalueof{/tikz/figurename}-zoom] {\phantomimage}
        }
    },
    color code/.style={
        zoombox paths/.append style={draw=#1}
    },
    connect zoomboxes/.style={
    spy connection path={\draw[draw=none,zoombox paths] (tikzspyonnode) -- (tikzspyinnode);}
    },
    help grid code/.code={
        \begin{scope}[
                x={(image.south east)},
                y={(image.north west)},
                font=\footnotesize,
                help lines,
                overlay
            ]
            \foreach \x in {0,1,...,9} { 
                \draw(\x/10,0) -- (\x/10,1);
                \node [anchor=north] at (\x/10,0) {0.\x};
            }
            \foreach \y in {0,1,...,9} {
                \draw(0,\y/10) -- (1,\y/10);                        \node [anchor=east] at (0,\y/10) {0.\y};
            }
        \end{scope}    
    },
    help grid/.style={
        append after command={
            [help grid code]
        }
    },
}

\newcommand\phantomimage{%
    \phantom{%
        \rule{\imagewidth}{\imageheight}%
    }%
}
\newcommand\zoombox[2][]{
    \begin{scope}[zoombox paths]
        \pgfmathsetmacro\xpos{
            (\columncount-1)*(\imagewidth / \pgfkeysvalueof{/tikz/zoomboxarray columns} + \pgfkeysvalueof{/tikz/zoomboxarray inner gap} / \pgfkeysvalueof{/tikz/zoomboxarray columns} ) + \pgflinewidth
        }
        \pgfmathsetmacro\ypos{
            (\rowcount-1)*( \imageheight / \pgfkeysvalueof{/tikz/zoomboxarray rows} + \pgfkeysvalueof{/tikz/zoomboxarray inner gap} / \pgfkeysvalueof{/tikz/zoomboxarray rows} ) + 0.5*\pgflinewidth
        }
        \edef\dospy{\noexpand\spy [
            #1,
            zoombox paths/.append style={
                black and white pattern=\patternnumber
            },
            every spy on node/.append style={#1},
            x=\imagewidth,
            y=\imageheight
        ] on (#2) in node [anchor=north west] at ($(zoomboxes container.north west)+(\xpos pt,-\ypos pt)$);}
        \dospy
        \pgfmathtruncatemacro\pgfmathresult{ifthenelse(\columncount==\pgfkeysvalueof{/tikz/zoomboxarray columns},\rowcount+1,\rowcount)}
        \global\let\rowcount=\pgfmathresult
        \pgfmathtruncatemacro\pgfmathresult{ifthenelse(\columncount==\pgfkeysvalueof{/tikz/zoomboxarray columns},1,\columncount+1)}
        \global\let\columncount=\pgfmathresult
        \ifblackandwhitecycle
            \pgfmathtruncatemacro{\newpatternnumber}{\patternnumber+1}
            \global\edef\patternnumber{\newpatternnumber}
        \fi
    \end{scope}
}


\begin{document}

\begin{figure}[ht]\centering
\begin{tikzpicture}[
    zoomboxarray,black and white=cycle,
]
    \node [image node] { \includegraphics[width=0.45\textwidth]{gallery} };
    \zoombox{0.27,0.9}
    \zoombox[color code=red,magnification=6]{0.4,0.83}
    \zoombox{0.42,0.45}
    \zoombox[magnification=5]{0.95,0.52}
\end{tikzpicture}
\caption{The National Gallery of Canada}
\end{figure}

\begin{figure}[ht]\centering
\begin{tikzpicture}[
    zoomboxarray
]
    \node [image node] { \includegraphics[width=0.45\textwidth]{gallery} };
    \zoombox{0.27,0.9}
    \zoombox[color code=red,magnification=6]{0.4,0.83}
    \zoombox{0.42,0.45}
    \zoombox[magnification=5]{0.95,0.52}
\end{tikzpicture}
\caption{The National Gallery of Canada}
\end{figure}

\end{document}
Jake
  • 232,450
  • 21
    TikZ (and your knowledge of it) continues to amaze me. – Alan Munn Aug 11 '11 at 00:43
  • @Jake: Can you check out the update to my post and see if my example builds for you? When I try to build your code with the margins required for my thesis, I get Dimension too large errors. Thanks. – SSilk Aug 12 '11 at 00:06
  • @Jake: Thanks. This works now, and the new version is very impressive. I've accepted your answer. I am still curious about the grids, and xport's answer has gotten me thinking that it would be nice to have an option to color-code the frames. Can you check out my new update to my question and see if you have any thoughts? I have the grid working, but I'm not sure how to add colored frames to the small images as shown in my last sample image. Thanks for all your help. – SSilk Aug 12 '11 at 02:06
  • @Jake: OK, I figured out the colored frames for the small images. I'll post my current version as another update to my post to see if you have any thoughts on any further tweaks, but right now I think it's doing everything I want it to. Thanks. – SSilk Aug 12 '11 at 02:33
  • @Jake: I have one more question for the moment: how hard is it to convert your code to use the subcaption package so I can use \subref and the hyperref package to get links to the two subfigures? – SSilk Aug 12 '11 at 03:34
  • @SSilk: I've changed the code to use subcaption now. Labelling works fine, but for some reason LaTeX complains about multiply defined labels. Can you see what's wrong? – Jake Aug 12 '11 at 04:25
  • @Jake: I noticed the same thing when I tried to integrate subcaption. As long as I put a subcaptionbox anywhere within the tikz figure, I'd get multiply defined labels. I have no idea what's wrong. Maybe it's a buggy interaction between Tikz and subcaption? If you can't see a solution for it, maybe I should start a new question about that since it's a bit off-topic from the original question here. – SSilk Aug 12 '11 at 13:07
  • @Jake: I tried your latest code, it looks great. It is still giving the multiply-defined labels warnings though. Specifically, when I use the first layout option (1 image, 4 zooms), I get 8x warnings for each label (-image and -zoom). Does anything about your macros make you think that the portion that assigns the labels might get called multiple times? – SSilk Aug 12 '11 at 13:27
  • @Jake: I will do that, and I'll post back here if I find out anything useful. If it turns out to be irreparable, what's involved in totally removing the subcaptions from your figures so it's just viewed as one figure? And one last thought on your current zoomboxes approach. The colored boxes are great in electronic form, but for grayscale printing they tend to be hard to see. Is it possible to have an option that, instead of coloring the outlines on the image, would just make them all black&white dotted lines for higher visibility in grayscale printing? – SSilk Aug 12 '11 at 14:03
  • @Jake: I hate to bother you again because you've put a ton of work into this question already, but I'm curious about my last request for black/white dotted lines as an optional outline on the large image since the colored outlines tend to be hard to see when printed in grayscale. Is this an easy addition? Or does it make more sense to start a new question about that specific item? Thanks. – SSilk Aug 13 '11 at 20:57
  • @SSilk: It's not very hard to add an option for black and white dotted lines. Are you thinking of using different dash/dot patterns for each box, or just the same pattern for all? – Jake Aug 14 '11 at 02:56
  • @SSilk: I've added a black and white key that draws monochrome dash patterns. To automatically use different patterns for each box, use black and white=cycle. – Jake Aug 14 '11 at 07:46
  • @Jake: This is awesome, thanks so much! I wonder, since your code is so detailed, would it make sense to look at either rolling it into an existing package/ library, i.e. re-work it into a Tikz library? I don't know what's involved in this though, I assume it's a lot of work. Optionally, it would be cool to post it somewhere like texample.net, which hosts a lot of Tikz examples? That's where I learned most of the small amount of Tikz stuff I know. – SSilk Aug 14 '11 at 14:36
  • @SSilk: Pleasure! It's a very useful thing, so I really enjoyed working on it. I think I'll make it part of the TeX.sx "From Answers to Packages" project. – Jake Aug 15 '11 at 03:43
  • @Jake: I'm using this lots and very pleased so far. I found a bug today though. If I make one figure using black and white, all following get stuck in B&W mode. Worse yet, if I use black and white=cycle, then make another set without explicitly using either black and white or black and white=cycle, I get hundred of errors. Appears TIKZ keeps trying to cycle through dash patterns from the last one, but runs out after four patterns, producing errors. Is there a way to update your code so that after the current use, it defaults back to color boxes to avoid these problems? Thanks. – SSilk Aug 22 '11 at 21:09
  • @SSilk: Sorry for that! You can insert \gdef\patternnumber{0} in the execute at end picture option of the zoomboxarray/.style to reset the counter at the end of the picture. Glad the code is useful! – Jake Aug 23 '11 at 04:44
  • Please, can we get a code like this one above with the MATLAB code. –  May 03 '12 at 22:41
  • Jake: this great answer became community wiki automatically because of many edits in short time. @percusse told me in the chat. If you wish, I'll gladly turn it to normal status with a recalc. – Stefan Kottwitz Apr 17 '13 at 20:44
  • @StefanKottwitz: Oh yes, that would be nice, thank you! – Jake Apr 18 '13 at 06:56
  • In question http://tex.stackexchange.com/questions/169739 I asked how to swap subcaption labels when placed on left side, and hacked it myself. I didn't knew to do better. Another feature: specifying the width (or height) ratio from zoombox dimensions to original dimensions would be awesome as well. Thank you so much for your work. It is very nice! – math Apr 05 '14 at 14:28
  • A nice way to use this for me would be to have main image on left in landscape (and in golden ratio), and a single zoom image in portrait (and in golden ratio) with same height beside it. How would I add a size or similar constraint to the zoombox? – a different ben Nov 18 '14 at 05:46
  • 4
    This would be a great package! – adn Apr 11 '15 at 15:30
  • 1
    Thanks for making this! Is it possible to remove the subfigure "numbers" (like (a), (b), ...)? – moi Sep 14 '16 at 15:07
  • @Jake you say ›magnficiations, ... , placed on any side of the original image...‹ how do I get one magnification on the left, then the original image and another magnification on the right? – lukascbossert Oct 22 '16 at 17:34
  • 1
    @Jake Is there a way to place the zoomed portions on a corner of the image itself? Rather than placing in a separate subfigure? – Sndn May 22 '18 at 08:42
  • Just wonderful!! Can we use \documentclass[border=1mm]{standalone}? – Shamina Dec 03 '18 at 14:30
  • I am using pdflatex, and this code is not working. The follow error is returning:

    ! Undefined control sequence. \tikz@atend@picture ...r sep=0pt] {\subcaptionbox {\label {\pgfkeysvalueof {... l.20 \end{tikzpicture}

    What is happanning?

    – Adriano Dec 12 '19 at 00:03
  • @Jake thank you for your contribution. Is it possible to add just the zoomed plots into another figure and omit it from the default figure? – epistemophiliac Apr 29 '20 at 18:11
  • Related: magnifications with adjustable width https://tex.stackexchange.com/q/583836/177 (still open) – Alessandro Cuttin Mar 01 '21 at 10:01
16

You can create the smaller images using the clip,trim=<llx> <lly> <urx> <ury> options for \includegraphics (instead of trim you could also use viewport). I would use a simply tabular environment two 2x2 cells for the alignment. For the big picture I would use TikZ to draw the red rectangles on it like shown in Drawing on an image with TikZ.

There is also a spy TikZ library for zooming out areas, which can also draw rectangle like this. Bu using it here might be overkill and actually more complex than doing it manual.

Martin Scharrer
  • 262,582
16

I just emphasize the clipping method since putting into sub-figure seems to be trivial. If you don't have an image to test, download one from my previous post.

enter image description here

Compile the following code either

  • with xelatex if the image is of type PNG, JPG, PDF, or EPS
  • or with latex-dvips-ps2pdf if the image is of type EPS.

See also the given link above for the details how to use PSTricks and to manage image inclusion.

XeLaTeX seems to be not so smart in clipping! I notice there is excessive spaces near the clipping edges. But it is almost ignorable practically.

\documentclass{article}
\usepackage{graphicx}
\usepackage{pstricks,pst-node}

\def\Scale{1}

\newsavebox\IBox
\savebox\IBox{\includegraphics[scale=\Scale]{Images/hen}}

\psset
{
    xunit=\dimexpr(\wd\IBox/10)\relax,
    yunit=\dimexpr(\ht\IBox/10)\relax
}

\parindent=0pt

\begin{document}
\pspicture(\wd\IBox,\ht\IBox)
\rput[bl](0,0){\usebox\IBox}
\psgrid[style=gridstyle]
\pnode(1,7){a}
\pnode(4,10){b}
\psframe[linecolor=blue](a)(b)
\endpspicture
\hfill
\psscalebox{2}{%
\pspicture(1,7)(4,10)
\pnode(1,7){A}
\pnode(4,10){B}
\psclip{\psframe(A)(B)}
\rput[bl](0,0){\usebox\IBox}
\endpsclip
\psframe[linecolor=blue](A)(B)
\endpspicture}
\psset{linecolor=red}
\ncline{a}{A}
\ncline{b}{B}

\end{document}
Display Name
  • 46,933
15

enter image description here

\documentclass{article}
\usepackage[a4paper,margin=2cm,showframe=false]{geometry}
\usepackage{graphicx}
\usepackage{pst-node}
\usepackage{subfig}


\newsavebox\Original
\savebox\Original{\includegraphics{Images/hen}}

\newsavebox\IBox
\savebox\IBox{\includegraphics[width=0.4\textwidth]{Images/hen}}

\pstFPdiv\scale{\the\wd\Original}{\the\wd\IBox}


\psset{
   xunit=\dimexpr(\wd\IBox/10)\relax,
   yunit=\dimexpr(\ht\IBox/10)\relax,
   linewidth=2pt}


\newcommand\CreateSubFig[6]{%
    \psframe[linecolor=#6](#2,#3)(#4,#5)%
    \expandafter\gdef\csname#1\endcsname{%
        \begingroup
        \fboxsep=0pt\fboxrule=\pslinewidth\color{#6}\fbox{%
        \includegraphics[
            width=\dimexpr0.2\textwidth-2\fboxsep-2\fboxrule\relax,
            viewport=
                {#2\dimexpr\scale\psxunit\relax}
                {#3\dimexpr\scale\psyunit\relax}
                {#4\dimexpr\scale\psxunit\relax}
                {#5\dimexpr\scale\psyunit\relax},
            clip]{Images/hen}}%
        \endgroup}}

\newcommand\MainFig{%
    \pspicture(\wd\IBox,\ht\IBox)
    \rput[bl](0,0){\usebox\IBox}
    \psgrid[style=gridstyle]
    \CreateSubFig{One}{1}{7}{4}{10}{red}
    \CreateSubFig{Two}{6}{6}{9}{9}{green}
    \CreateSubFig{Three}{2}{3}{5}{6}{blue}
    \CreateSubFig{Four}{3.5}{0}{6}{2.5}{yellow}
    \endpspicture}

\begin{document}

\figure[hbtp]
\centering
\subfloat{\MainFig}\hspace{0.05\textwidth}
\subfloat[Sliced chicken]{%
    \vbox{%
        \offinterlineskip
        \halign{%
            #&\hskip3pt#\cr
            \One&\Two\cr
            \noalign{\vskip3pt}%
            \Three&\Four\cr}}}
\caption{This is my pet!}
\endfigure

\end{document}
Display Name
  • 46,933
  • I will create a macro to ease specifying a viewport by letting the user only pass the center point and scale values. The scale is relative to the whole image while maintaining its aspect ratio. See you later! – Display Name Aug 11 '11 at 10:52
  • This doesn't work for me. I am using MikTeX 2.8 and TeXnic Center 2 in Windows 7. The only build profile available to me that builds this without errors is XeLaTeX->PDF, and it gives me a warning that clipping is not supported, and in the resulting PDF, the images on the right that should be cropped are instead full size. – SSilk Aug 11 '11 at 19:05
  • @SSilk: You have to upgrade your MikTeX because it was the old issue, see Why cannot XeLaTeX clip my PSTricks graph plot correctly?. – Display Name Aug 11 '11 at 20:55
  • I just upgraded to MikTeX 2.9 (the latest version), and the clipping problem is the same. Is there a specific package that needs to be updated separately? – SSilk Aug 11 '11 at 23:50