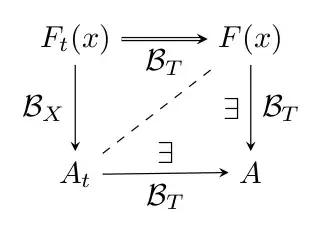
I wish I knew how to draw the this commutative diagram with the TikZ package.

I would also like to know how to put subtitles in the diagram.
I wish I knew how to draw the this commutative diagram with the TikZ package.
I would also like to know how to put subtitles in the diagram.
Here's a start diagram for you:
figure environment or the caption package\documentclass{article}
\usepackage{tikz}
\usetikzlibrary{matrix}
\begin{document}
\begin{tikzpicture}
\matrix (m) [matrix of math nodes,row sep=3em,column sep=4em,minimum width=2em] {
F_t(x) & F(x) \\
A_t & A \\};
\path[-stealth]
(m-1-1) edge node [left] {$\mathcal{B}_X$} (m-2-1)
edge [double] node [below] {$\mathcal{B}_t$} (m-1-2)
(m-2-1.east|-m-2-2) edge node [below] {$\mathcal{B}_T$} node [above] {$\exists$} (m-2-2)
(m-1-2) edge node [right] {$\mathcal{B}_T$} (m-2-2)
edge [dashed,-] (m-2-1);
\end{tikzpicture}
\end{document}

Scaling is no problem: simply scale the font by \Large, \Huge etc. The complete matrix will scale because the distances have been given in em units, which scale with the font size. Regarding possibly scaling arrow tips, searching the site should give some hits.
scale=2,transform shape, you could simply use a larger font such as by \Large, you can change row sep and column sep, or simply scale all by \resizebox or \scalebox of the graphicx package.
– Stefan Kottwitz
Feb 25 '12 at 13:30
Here's another option using the positioning library, which is nice because you specify nodes in terms of relative positions to one another
\documentclass{article}

\usepackage{tikz}
\usetikzlibrary{positioning}

% set arrows as stealth fighter jets
\tikzset{>=stealth}

\begin{document}

\begin{center}
\begin{tikzpicture}
    % set up the nodes
    \node (E) at (0,0) {$F_t(x)$};
    \node[right=of E] (F) {$F(x)$};
    \node[below=of F] (A) {$A$};
    \node[below=of E] (Asubt) {$A_t$};
    % draw arrows and text between them
    \draw[->,double] (E)--(F) node [midway,below] {$\mathcal{B}_T$};
    \draw[->] (F)--(A) node [midway,right] {$\mathcal{B}_T$}
                node [midway,left] {$\exists$};
    \draw[->] (Asubt)--(A) node [midway,below] {$\mathcal{B}_T$}
                node [midway,above] {$\exists$};
    \draw[->] (E)--(Asubt) node [midway,left] {$\mathcal{B}_X$};
    \draw[dashed] (Asubt)--(F);
\end{tikzpicture}
\end{center}

\end{document}
anchor=base for the nodes A, F, E and Asubt. As they are now they will be aligned wrt their center which may result not very pleasing when they contain text of different depth/height.
– Bordaigorl
Sep 29 '13 at 14:29
anchor=base before the positioning keys or they get confused...
– Bordaigorl
Sep 29 '13 at 14:34
You can have a shorter code using tikz-cd:
\begin{tikzcd}[swap]
    F_t(x) \arrow[Rightarrow]{r}[inner sep = 1ex]{\mathcal{B}_T}
           \arrow{d}{\mathcal{B}'_X}
  & F(x) \arrow{d}[swap]{\mathcal{B}_X}{\exists} \\
    A_t \arrow{r}[swap]{\exists}{\mathcal{B}_T} \arrow[dashed,dash]{ur}
  & A
\end{tikzcd}
! Package pgfbasematrix Error: Single ampersand used with wrong catcode.
– KeithB May 19 '15 at 10:35& with \pgfmatrixnextcell and try again. See answer but ampersand replacement didn't work for me.
– Liam
Oct 07 '15 at 13:10
Always with tkz-graph
Picture

Code
\documentclass{article}
\usepackage{tkz-graph}
\usetikzlibrary{arrows}

\begin{document}
\begin{tikzpicture}

% unit
\SetGraphUnit{3}

% style for vertex
\GraphInit[vstyle=Empty]
\tikzset{VertexStyle/.append style = {shape=rectangle,inner sep=0pt}}

% vertices
\Vertex[L=$A_t$]{1}
\EA[unit=3,L=$A$](1){2}
\NO[unit=2,L=$F_t(x)$](1){4}
\NO[unit=2,L=$F(x)$](2){3}

%  edges  and labels
\begin{scope}[every node/.style={midway},>=latex']
  \draw[->,double] (4)--(3) node [below] {$\mathcal{B}_T$};
  \draw[->]        (3)--(2) node [right] {$\mathcal{B}_T$}
                            node [left]  {$\exists$};
  \draw[->]        (1)--(2) node [below] {$\mathcal{B}_T$}
                            node [above] {$\exists$};
  \draw[->]        (4)--(1) node [left]  {$\mathcal{B}_X$};
  \draw[dashed]    (1)--(3);
\end{scope}
\end{tikzpicture}
\end{document}
The following shows a commutative diagram of the homomorphism theorem. There's a subtlety, which is often forgotten, namely that you shouldn't specify row separations in absolute lenghts but in relative lengths that depend on the size of the type: in my case I am using the em. I specify the distance between the columns and rows is specified in multiples of the type size (ems), not in cm or other units that don't depend on the type size. The advantage of this is that the distances also look good when you scale the picture. (I'm not sure if it's easy to scale the arrows....)
\documentclass{article}
\usepackage{tikz}
\begin{document}

\begin{tikzpicture}[every node/.style={midway}]
\matrix[column sep={4em,between origins},
        row sep={2em}] at (0,0)
{ \node(R)   {$R$}  ; & \node(S) {$S$}; \\
  \node(R/I) {$R/I$};                   \\};
\draw[<-] (R/I) -- (R) node[anchor=east]  {$\chi$};
\draw[->] (R/I) -- (S) node[anchor=north]  {$\psi$};
\draw[->] (R)   -- (S) node[anchor=south] {$\phi$};
\end{tikzpicture}

\begin{Huge}
\begin{tikzpicture}[every node/.style={midway}]
\matrix[column sep={4em,between origins},
        row sep={2em}] at (0,0)
{ \node(R)   {$R$}  ; & \node(S) {$S$}; \\
  \node(R/I) {$R/I$};                   \\};
\draw[<-] (R/I) -- (R) node[anchor=east]  {$\chi$};
\draw[->] (R/I) -- (S) node[anchor=north]  {$\psi$};
\draw[->] (R)   -- (S) node[anchor=south] {$\phi$};
\end{tikzpicture}
\end{Huge}

\end{document}
This example may also be found in Chapter 5 of LaTeX and Friends.