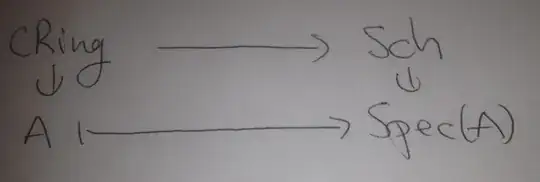
I want to make a diagram that looks like the following:
There is a not so complicated answer using the packages graphicx and xypic. Before explaining I will straight away give my solution. It is the following:
\usepackage{graphicx}
\usepackage{xypic}
\usepackage{amsmath}

\begin{align*}
\xymatrix@R=10pt{
    cRing \ar[r] & Sch \\
    A \ar@{}[u]|{\rotatebox{90}{$\in$}} \ar@{|->}[r]
            & Spec(A) \ar@{}[u]|{\rotatebox{90}{$\in$}}
}
\end{align*}
NOTE that diagram should of course be enclosed in \begin{document} and \end{document}. Of course it is not important that align* is used, any display-style math envisonment will do. The package amsmath is also just included to make align* available, since it is my favorite.
Now for the explanation. I will assume that you already know a little about the xypic. This package is really easy to use on a basic level. Here it has been used in a little more advanced way. The option @R=10pt between \xymatrix and the following { is an option the specifies the 'row spacing', and in this case we want it to be small so that the picture does not look silly. The top arrow is a standart arrow in xypic drawn with \ar[r] but the lower arrow has the extra symbols @{|->} which just specifies that we want this arrow to have that special look. In genneral it you want to rotate a symbol in LaTeX the graphicx package includes the command \rotatebox which allows for rotating element, e.g. the symbol \in. These symbols are placed like arrows with the command
\ar@{}[u]|{\rotatebox{90}{$\in$}}
Now \rotatebox{90}{$\in$} is jost a 90 degrees rotation of the symbol \in. The symbols @{} specifies that we want an 'empty' arrow, i.e. an arrow with no lines, and the symbols |{\rotatebox{90}{$\in$}} specify that we want \rotatebox{90}{$\in$} places as a lable on top of the given arrow.
\newcommand{\mapdef}[4]{ \begin{tikzpicture} \node (A) at (0,0) {#1}; \node (B) at (2,0) {#2}; \node (C) at (0,-1) {#3}; \node (D) at (2,-1) {#4}; %\path[|->,font=\scriptsize] \draw[->] (A) edge node[above] {} (B); \draw[|->] (C) edge node[above] {} (D); \draw[transparent] (A) edge node[rotate=90,opacity=1] {$\in$} (C); \draw[transparent] (B) edge node[rotate=90,opacity=1] {$\in$} (D); \end{tikzpicture} }
\begin{document}
$$\mapdef{A}{B}{a}{b}$$
\end{document}
– user13372 Apr 08 '12 at 00:58align* and around displaymath (or \[...\], which is the same) is different and the former is often too much for a single equation.
– egreg
Apr 11 '12 at 13:39