The alignment can be changed using
legend cell align=left,
The other issues can be changed in a variety of different ways- in what follows I didn't use samples=2000 as it increases the compiling time quite significantly- the question was independent from this though.
- using
legend style={legend pos=north west,font=\tiny} gives

\begin{tikzpicture}
\begin{axis}[scale only axis,
                    legend cell align=left,
         /pgfplots/enlargelimits=false,
          legend style={legend pos=north west,font=\tiny}]
  \addplot[domain=0:30] {5*exp(-((x-5*pi)/(2.5*pi))^2)*sin(deg(2*x))+x};
  \addplot[domain=0:30] {x};
  \legend{$f(x) = 5\exp\left(-\left(\dfrac{x-5\pi}{2.5\pi}\right)^2\right)
             \sin(2x) + x$,
          $f(x)_\text{fit} = x$}
\end{axis}
\end{tikzpicture}

- Using a blank line in the legend

\begin{tikzpicture}
\begin{axis}[scale only axis,
         /pgfplots/enlargelimits=false,
         legend cell align=left,
         legend style={legend pos=north west,font=\tiny}]
  \addplot[domain=0:30] {5*exp(-((x-5*pi)/(2.5*pi))^2)*sin(deg(2*x))+x};
  \addlegendentry{$f(x) = 5\exp\left(-\left(\dfrac{x-5\pi}{2.5\pi}\right)^2\right)$}
  \addlegendimage{empty legend};
  \addlegendentry{};
  \addplot[domain=0:30] {x};
  \addlegendentry{$f(x)_\text{fit} = x$};
\end{axis}
\end{tikzpicture}
- Or you could put the legend in the
caption using \label and \ref
\begin{figure}
\begin{tikzpicture}
\begin{axis}[scale only axis,
legend cell align=left,
/pgfplots/enlargelimits=false,
legend style={legend pos=north west,font=\tiny}]
\addplot[domain=0:30] {5*exp(-((x-5*pi)/(2.5*pi))^2)*sin(deg(2*x))+x};
\label{plot:firstplot};
\addplot[domain=0:30] {x};
\label{plot:secondplot};
\end{axis}
\end{tikzpicture}
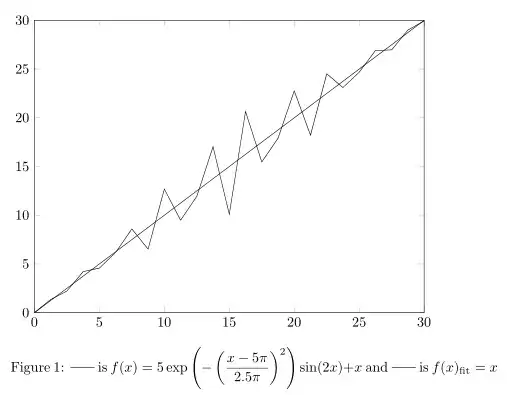
\caption{\ref{plot:firstplot} is $f(x) = 5\exp\left(-\left(\dfrac{x-5\pi}{2.5\pi}\right)^2\right)\sin(2x) + x$ and
\ref{plot:secondplot} is $f(x)_\text{fit}=x$}
\end{figure}

\legend{{\raisebox{1.5ex}{$f(x) = 5\exp\left(-\left(\dfrac{x-5\pi}{2.5\pi}\right)^2\right)\sin(2x) + x$}},$f(x)_\text{fit} = x$}– percusse Mar 19 '12 at 19:46