0

I would like to draw a Minkowski diagram for two frames of reference, something like enter image description here

using LaTeX, perhaps pgfplots. I've done regular plots with pgfplots and saw that axis can be rotated, but haven't found a way to use non-orthogonal axis. Is this even possible and if so, how?

Ideally I'd like to define the non-orthogonal coordinate system and then draw by just specifying coordinates in that system.

If that's not possible, I would have to manually draw arrows for the axis, but how would I add tick marks and tick labels then?

user1583209
  • 785
  • 4
  • 12
  • 1
    In plain TikZ, if you define three points O, I, J, you can place whatever point you need by calculating their coordinates depending on O, I, J (using calc library and a simple macro, for example). – SebGlav Jun 20 '21 at 11:05
  • Thanks. That helps with the calculation, but how would I add rotated tick marks? – user1583209 Jun 20 '21 at 11:26
  • Maybe with a scope environment with a rotate parameter? Did you try something yet? – SebGlav Jun 20 '21 at 11:41

3 Answers3

2

I my opinion the better approach here is a scope. In it you can define your axes and all you draw inside is referred at these axes. As an example:

\documentclass[border=2mm]{standalone}
\usepackage   {tikz}

\tikzset% {% red axis/.style={thick,red!50!black}, green axis/.style={thick,green!50!black}, }

\begin{document} \begin{tikzpicture}[line cap=round] % x, ct axes (red) \begin{scope} % this scope in not really necessary \draw[red axis] (-5,0) -- (5,0); \draw[red axis] (0,-5) -- (0,5); \foreach\i in {1,...,5} {% ticks \draw[red axis] (-\i,-0.05) -- (-\i,0.05); \draw[red axis] ( \i,-0.05) -- ( \i,0.05); \draw[red axis] (-0.05,-\i) -- (0.05,-\i); \draw[red axis] (-0.05, \i) -- (0.05, \i); } \draw[gray,dashed] (1,0) -- (1,1) -- (0,1); \draw[gray,dashed] (4,0) -- (4,1); \draw[gray,dashed] (0,4) -- (1,4); \draw[red] (1,1) -- (4,1) -- (4,4) -- (1,4) -- cycle; \draw[red] (2.5,2.5) circle (1.5); \node at (5,0) [right] {$x$}; \node at (0,5) [above] {$ct$}; \node at (1,0) [below] {$u$}; \node at (0,1) [left] {$u$}; \end{scope} % x', ct' axes (green) \begin{scope}[x={(30:1.5 cm)}, y={(60:1.5 cm)}] \draw[green axis] (-5,0) -- (5,0); \draw[green axis] (0,-5) -- (0,5); \foreach\i in {1,...,5} {% ticks \draw[green axis] (-\i,-0.05) -- (-\i,0.05); \draw[green axis] ( \i,-0.05) -- ( \i,0.05); \draw[green axis] (-0.05,-\i) -- (0.05,-\i); \draw[green axis] (-0.05, \i) -- (0.05, \i); } \draw[gray,dashed] (1,0) -- (1,1) -- (0,1); \draw[gray,dashed] (4,0) -- (4,1); \draw[gray,dashed] (0,4) -- (1,4); \draw[green] (1,1) -- (4,1) -- (4,4) -- (1,4) -- cycle; \draw[green] (2.5,2.5) circle (1.5); \node at (5,0) [right] {$x'$}; \node at (0,5) [above] {$ct'$}; \node at (1,0) [below] {$u'$}; \node at (0,1) [left] {$u'$}; \end{scope} \end{tikzpicture} \end{document}

enter image description here

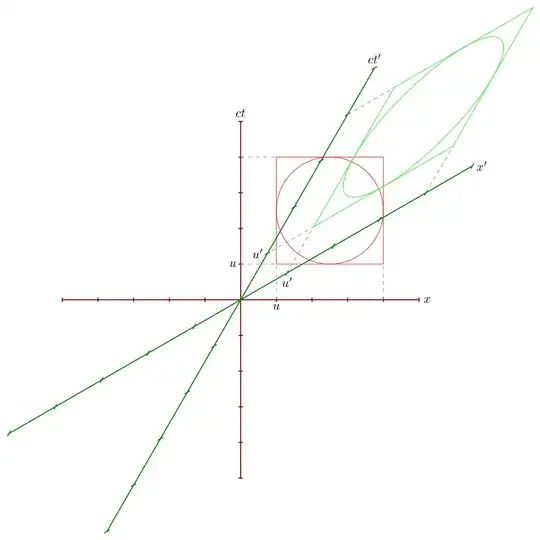
Note that in the green axes the ticks are not orthogonal, because neither are the axis. I prefer them as they are but if you need them to be orthogonal, as in your example, you need to draw them outside the scope environment.

Juan Castaño
  • 28,426
1

Both TikZ and PGFPlot has their own unit vectors. When needed it is preferred to only change the vectors in PGFPlots like this:

\documentclass[tikz, border=1 cm]{standalone}
\usepackage{pgfplots}
\pgfplotsset  {compat=1.17}
\begin{document}
\begin{tikzpicture}

\begin{axis}[ red, anchor=center, axis lines=center, xmin=-5, xmax=5, ymin=-5,ymax=5, xtick distance=1, xticklabel={\empty}, ytick distance=1, yticklabel={\empty}, x={1cm}, y={1cm}, xlabel={$x$}, ylabel={$ct$}, thick, every tick/.style={thick}, ] \addplot[mark=*] coordinates {(1,3)}; \draw (1,3) circle[radius=1]; \end{axis}

\begin{axis}[ green!50!black, anchor=center, axis lines=center, xmin=-4, xmax=4, ymin=-4,ymax=4, xtick distance=1, xticklabel={\empty}, ytick distance=1, yticklabel={\empty}, x={(1.25cm,0.75cm)}, y={(0.75cm,1.25cm)}, xlabel={$x'$}, ylabel={$ct'$}, thick, every tick/.style={thick}, ] \addplot[mark=*] coordinates {(1,1)}; \draw (1,1) circle[radius=1]; \end{axis}

\end{tikzpicture} \end{document}

Graph

0

I do not know exactly what OP wants. If he just want that figure, then plain TikZ with some suitable scope and geometric transformations xscale, yscale do the job.

enter image description here

\documentclass[tikz,border=5mm]{standalone}
\begin{document}
\begin{tikzpicture}[thick]
\begin{scope}[brown]
\draw (-5,0)--(5,0) node[right]{$X$};       
\draw (0,-5)--(0,5) node[above]{$ct$};
\foreach \i in {-5,...,5}
\draw (\i,.1)--(\i,-.1) (.1,\i)--(-.1,\i)
(1,0) node[below=1mm]{$U$}
(0,1) node[left=1mm]{$U$}
;
\end{scope}

\newcommand\Xpunit{1.2} \newcommand\Xpangle{55} % angle from the X axe \begin{scope}[teal,rotate=\Xpangle,xscale=\Xpunit] \draw (-4,0)--(4,0) node[right]{$X'$};
\foreach \i in {-4,...,-1,1,2,...,4} \draw (\i,.1)--(\i,-.1) (1,0) node[below right=1mm]{$U'$}; \end{scope}

\newcommand\ctpunit{1.2} \newcommand\ctpangle{35} % angle from the ct axe \begin{scope}[teal,rotate=\ctpangle,yscale=\Xpunit] \draw (0,-4)--(0,4) node[above]{$ct'$};
\foreach \i in {-4,...,-1,1,2,...,4} \draw (.1,\i)--(-.1,\i) (0,1) node[left=1mm]{$U'$}; \end{scope}

\fill (0,0) circle(2pt); \end{tikzpicture} \end{document}

Black Mild
  • 17,569