Actually, IMHO these could be seen as two different questions.
So, let's start with the first one:
I am plotting a function y = a*x^2 with a is variable constant. I would like to control a interactively but I google and seems that TikZ doesn't support interactive operation.
I would use for this the wonderful ocgx package in combination with pgfplots; along the site you can find already some examples:
The code:
\documentclass{article}
\usepackage{pgfplots}
\usetikzlibrary{ocgx}
\tikzset{ocg button/.style={circle,inner sep=.25em,switch ocg with mark on={#1}{}}}
\tikzset{base/.style={baseline=-0.5ex}}
\newcommand{\function}{\x^2}
\newcommand{\button}[2]{\tikz[base]\node[fill=#2!30,ocg button=#1]{};}
\newcommand{\plotit}[2]{\addplot+[ocg={name=#2,ref=#2}]{#1};\label{#2}}
\newcommand{\legendit}[3]{\item[\ref{#1}] #2$x^2$ \button{#1}{#3}}
\begin{document}
\begin{minipage}[b][0.4\textheight][l]{0.7\textwidth}
\begin{tikzpicture}
\begin{axis}[grid= major,xlabel=$x$,
ylabel =$y$,
ylabel style={rotate=-90},
cycle list={blue,red,green!50!lime,orange,cyan!50!blue},
]
\plotit{\function}{first}
\plotit{1.5\function}{second}
\plotit{2.25\function}{third}
\plotit{3\function}{fourth}
\plotit{5\function}{fifth}
\end{axis}
\end{tikzpicture}
\end{minipage}%
\begin{minipage}[b][0.5\textheight][c]{0.2\textwidth}
\begin{itemize}
\legendit{first}{}{blue}
\legendit{second}{1.5}{red}
\legendit{third}{2.25}{green!50!lime}
\legendit{fourth}{3}{orange}
\legendit{fifth}{5}{cyan!50!blue}
\end{itemize}
\end{minipage}%
\end{document}
The result (clicking on the second and fourth button):

Disclaimer
This works for me under Evince (standard version coming with Ubuntu 12.10) and Acrobat Reader.
Let's now come to the second question:
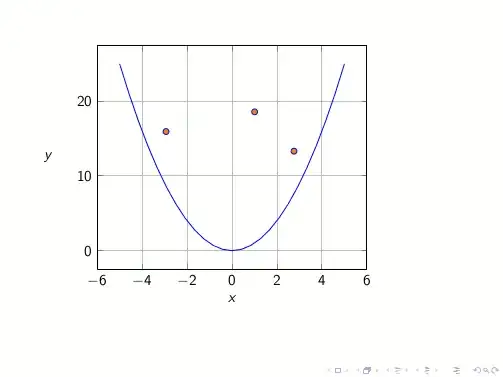
Also, I want to know if there is any way to draw some points within the function and moving randomly?
For this, I would use the standalone class with option tikz and place sequentially the points along the plot with the facility
node[<some opitons>, pos=<position along the plot>]
where <position along the plot> should be some number from 0 to 1.
An example:
\documentclass[tikz]{standalone}
\usepackage{pgfplots}
\begin{document}
\foreach \pos in {0,0.05,...,1.05}{
\begin{tikzpicture}
\begin{axis}[grid= major,xlabel=$x$,
  ylabel =$y$,
  ylabel style={rotate=-90},
  no marks,
  ]
\addplot{\x^2}
    node[fill=orange,draw=blue,circle,inner sep=1pt, pos=\pos]{}
  ;
\end{axis}
\end{tikzpicture}
}
\end{document}
The result:

If you want random points, just change the list inside
\foreach \pos in {0,0.05,...,1.05}
where with change I mean you have to shuffle the order (that for simplicity I did not).
One remark: the list ends in 1.05 and not 1 to correctly display the final point.
To have random points inside the plot there are basically two ways: the first one is again by means of the standalone class (a couple of examples are in the answers of Draw a closed liquid-droped shaped curve with TikZ) while the second one exploits the Beamer class; with the styles defined in Highlighting in Beamer using TikZ nodes it is possible to locate some nodes specifying the moment in which they appear: this creates a sort of randomicity.
The code:
\documentclass{beamer}
\usepackage{lmodern}
\usepackage{pgfplots}
\tikzset{
    invisible/.style={opacity=0,text opacity=0},
    visible on/.style={alt=#1{}{invisible}},
    alt/.code args={<#1>#2#3}{%
      \alt<#1>{\pgfkeysalso{#2}}{\pgfkeysalso{#3}}
    },
}
% https://tex.stackexchange.com/questions/84513/highlighting-in-beamer-using-tikz-nodes/84608#84608
\tikzset{
  background filldraw/.style args={#1 and #2}{draw=#1, fill=#2},
  background filldraw/.default={white and white},
  filldraw on/.style={alt=#1{}{background filldraw}},
}
\begin{document}
\begin{frame}{}
\begin{tikzpicture}
\begin{axis}[grid= major,xlabel=$x$,
  ylabel =$y$,
  ylabel style={rotate=-90},
  no marks,
  ]
\addplot{\x^2};
\end{axis}
\foreach \pos/\moment in {{(4,4)}/{1,3,5,6},{(2,2)}/{2,3,4,8},
 {(1.5,4)}/{2,4,5,7},{(5,3)}/{1,2,3,5,8},{(2.5,1.5)}/{2,4,5,6},
 {(1.75,3.5)}/{1,3,6,8},{(3.75,2.5)}/{2,5,7,8},{(3.75,1.25)}/{2,3,4,5,6}}{
 \node[circle, inner sep=1.5pt,
   background filldraw={blue and orange},
   filldraw on=<\moment>] at \pos {};
}
\end{tikzpicture}
\end{frame}
\end{document}
The result: