2

Possible Duplicate:
Remove tick labels, but retain tick marks in RegionPlot (and related functions)

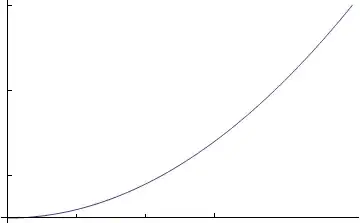
I need to display a 2D graph, say $y=x^2$ with tick-marks along the $x$ and $y$-axes but with no numbers (e.g. 1, 2, 3 ...) indicating these tick-mark values.

What is the most efficient way to perform this task? Thanks!

QuantumDot
  • 19,601
  • 7
  • 45
  • 121
  • Would you please clarify the intent of this question? Is this a duplicate?: http://mathematica.stackexchange.com/q/2073/121 – Mr.Wizard Oct 20 '12 at 19:49

3 Answers3

8

This isn't clever, but it works:

Plot[x^2, {x, 0, 10}, LabelStyle -> {White}]

Is that sufficient? But, I think the use of FrameTicksStyle in the link in Mr.Wizards answer is better. Alternatively, specifying your own ticks as MW says gives you more control of tick placement. It's easier to use Table to specify the ticks, though.

Mr.Wizard
  • 271,378
  • 34
  • 587
  • 1,371
George Wolfe
  • 5,462
  • 21
  • 43
5

For example:

Plot[x x, {x, 0, 1}, Ticks -> ({#, #} &@Array[{1/10 #,} &, 10])]

Mathematica graphics

Dr. belisarius
  • 115,881
  • 13
  • 203
  • 453
4

If you are asking to preserve the Automatic ticks but remove their labels this is a duplicate of: Remove tick labels, but retain tick marks in RegionPlot (and related functions)

If you are asking to place your own ticks without labels you can simply specify an empty string "" or Spacer[0] as the tick label.

Plot[x^2, {x, 0, 5}, 
 Ticks -> {{{1, Spacer[0]}, {2, Spacer[0]}, {3, Spacer[0]}},
           {{5, Spacer[0]}, {15, Spacer[0]}, {25, Spacer[0]}}}
]

Mathematica graphics

Mr.Wizard
  • 271,378
  • 34
  • 587
  • 1,371