10

Working with trig functions, period, amplitude, etc.

I found a worksheet at a calculus website, with some nice questions related to interpreting trig functions, at least, they provide some "fun" context.

It has to do with a couple, different phases in their relationship, etc.

See http://math.arizona.edu/~calc/m124/Denise&Chad.pdf

Anyway, my Mathematica question, is related to filling between two curves.

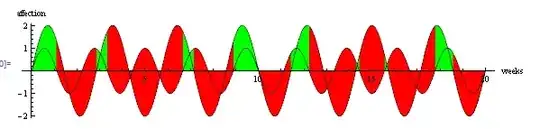
In the worksheet, consider that "happy" means positive. A couple is “happy” when they both like each other. A couple is unhappy when they both dislike each other.

Here are the two curves as given in the worksheet.

Plot[{Sin[9 \[Pi] t/10], 2 Sin[7 \[Pi] t/10]}, {t, 0, 20}, 
 AspectRatio -> 0.2, AxesLabel -> {"weeks", "affection"}]

enter image description here

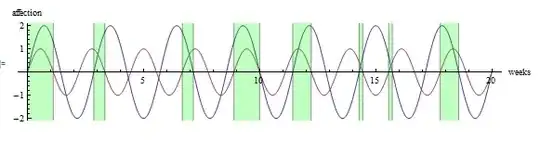
Is there a clever Mathematica way to fill in just those portions of the curve where the couple are happy, I.E. both are positive? Is there a nice way to visualize this?

Mr.Wizard
  • 271,378
  • 34
  • 587
  • 1,371
Tom De Vries
  • 3,758
  • 18
  • 36
  • I'm not sure of etiquette here, didn't want to change my question, and I'm delighted with the graphs, it's helped a lot... the specific question in the worksheet, which I should have asked, is what is the PERCENTAGE of time the couple are happy....? – Tom De Vries Nov 15 '12 at 23:05
  • THANKS to all the responders, everything was helpful and I learned a lot. hard to chose an answer but went with Andy's, though Chris' was the simplest to follow. Andy's (I think) illustrated the actual band of time better. Thanks again to everyone who responded. – Tom De Vries Nov 16 '12 at 20:34

5 Answers5

14

Here's happy:

Plot[{Sin[9 \[Pi] t/10], 2 Sin[7 \[Pi] t/10]}, {t, 0, 20}, 
 AspectRatio -> 0.2, AxesLabel -> {"weeks", "affection"}, 
 Filling -> {1 -> {Axis, {None, Green}}, 1 -> {{2}, White}}]

enter image description here

Chris Degnen
  • 30,927
  • 2
  • 54
  • 108
8

Seems incredibly wasteful to repeat the plots but this does at least work. Notice the use of ColorFunctionScaling->False. This is necessary here.

Show[
  Plot[{2 Sin[7 \[Pi] t/10],Sin[9 \[Pi] t/10]}, {t, 0, 20}, Filling -> Axis, 
   ColorFunctionScaling -> False, 
   ColorFunction -> 
    Function[{x, y}, 
     If[2 Sin[7 \[Pi] x/10] > 0 && Sin[9 \[Pi] x/10] > 0, Green, 
      Red]]]
  , 
  Plot[{2 Sin[7 \[Pi] t/10], Sin[9 \[Pi] t/10]}, {t, 0, 20}, 
   PlotStyle -> Black], 
    AxesLabel -> {"weeks", "affection"}, AspectRatio -> .2
 ]

enter image description here

Edit:

You could alternatively use RegionPlot to do the shading. The PlotPoints need to be set quite high to pick up the smaller regions.

Show[Plot[{2 Sin[7 \[Pi] t/10], Sin[9 \[Pi] t/10]}, {t, 0, 20}, 
  AxesLabel -> {"weeks", "affection"}, AspectRatio -> .2], 
 RegionPlot[
  2 Sin[7 \[Pi] t/10] > 0 && Sin[9 \[Pi] t/10] > 0, {t, 0, 
   20}, {y, -4, 4}, PlotStyle -> Directive[Opacity[.25], Green],
 PlotPoints -> 250]]

enter image description here

Edit 2:

I seem to be unable to stop having fun with this one. It is much faster to use Plot with Boole than to use RegionPlot in this case since the regions are simple rectangles.

Show[Plot[{2 Sin[7 \[Pi] t/10], Sin[9 \[Pi] t/10]}, {t, 0, 20}, 
  AxesLabel -> {"weeks", "affection"}, AspectRatio -> .2], 
 Plot[{-2, 2} Boole[
    2 Sin[7 \[Pi] t/10] > 0 && Sin[9 \[Pi] t/10] > 0], {t, 0, 20}, 
  Filling -> Axis, PlotStyle -> None, 
  FillingStyle -> Directive[Opacity[.5], Pink], PlotPoints -> 150]]

enter image description here

Andy Ross
  • 19,320
  • 2
  • 61
  • 93
  • Ok, I managed to bring it down to effectively one plot call (although, I'd go with Chris' answer): Show[{#, DeleteCases[#, _Polygon | HoldPattern[VertexColors -> v___], ∞] /. h_Hue :> Black} &@ Plot[{2 Sin[7 π t/10], Sin[9 π t/10]}, {t, 0, 20}, Filling -> Axis, ColorFunctionScaling -> False, ColorFunction -> Function[{x, y}, If[2 Sin[7 π x/10] > 0 && Sin[9 π x/10] > 0, Green, Red]]]] – rm -rf Nov 15 '12 at 22:27
  • 1
    @rm-rf definitely cool but also sufficiently scary that I think I'll leave what I have :). – Andy Ross Nov 15 '12 at 22:43
  • This is more complicated, but in some ways seems to more accurately reflect a "band of time". I really like the elegance of Chris's answer, but which one would be a more helpful "mathematical" answer? – Tom De Vries Nov 15 '12 at 23:34
  • 1
    Incidentally, I think my latest edit makes it clear how one might compute the percentage of time they are both happy. NIntegrate[ Boole[Sin[7 \[Pi] t/10] > 0 && Sin[9 \[Pi] t/10] > 0], {t, 0, 20}]/20 – Andy Ross Nov 16 '12 at 00:26
  • Hmm.. not sure. I can't find a way to arrive at 33 1/3%. – Andy Ross Nov 16 '12 at 02:06
2

may be another option

f1[t_] := Sin[9 Pi t/10];
f2[t_] := 2 Sin[7 Pi t/10];
data=Table[{t,If[f1[t]>0 && f2[t] > 0, Max[{f1[t],f2[t]}], 0]},{t,0,20,0.01}];
p1 = ListPlot[data, Joined -> True, Filling -> Axis,FillingStyle -> Green];
p2 = Plot[{f1[t], f2[t]}, {t, 0, 20},AxesLabel->{"weeks","affection"},Evaluated -> True];
Show[p2, p1]

enter image description here

Nasser
  • 143,286
  • 11
  • 154
  • 359
2
 {f1, f2} = {Sin[9 \[Pi] t/10], 2 Sin[7 \[Pi] t/10]};
 Plot[{f1, f2, ConditionalExpression[#, # >= 0] &[Min[f1, f2]]}, {t, 0, 20},
 Filling -> {3 -> {Axis, Green}}, PlotStyle -> Thick,
  AspectRatio -> 0.2, Frame -> False, Axes -> False]

enter image description here

(Axes removed to show that the added function does not produce a line at zero.)

kglr
  • 394,356
  • 18
  • 477
  • 896
1

To answer the second, rather different question concerning the percentage of time the couple are happy, here is one way of calculating it:-

(* Find roots up to t = 20 (period of sin(ax) is 2 Pi/a) *)
r1 = Table[t, {t, 0, 20, 10/9}];
r2 = Table[t, {t, 0, 20, 10/7}];

(* Establish when going positive *)
d1 = Sign[D[Sin[9 \[Pi] t/10], t] /. t -> r1];
d2 = Sign[D[2 Sin[7 \[Pi] t/10], t] /. t -> r2];

(* Join in a list for processing *)
m1 = Transpose[{r1, d1, ConstantArray[0, Length[r1]]}];
m2 = Transpose[{r2, ConstantArray[0, Length[r2]], d2}];
m = Sort[Join[m1, m2]];

process[{a_, b_, c_}] := Module[{},
  Which[b == 1, y = 1, b == -1, y = 0];
  Which[c == 1, z = 1, c == -1, z = 0];
  AppendTo[list, If[y + z == 2, {"happy", a}, {"not so happy", a}]]]

y = z = 0;
list = {};

process /@ m;

ToString[First[Total[
      {Last[#2] - Last[#1]} & @@@ Cases[Partition[list, 2, 1],
        {{"happy", _}, _}]]/20*100.]] <> "%"

25.3968%

Chris Degnen
  • 30,927
  • 2
  • 54
  • 108