12

I know it is possible to create a filling in between two curves on a 2D plot, but is it possible to do the same in 3D?

My attempt like this:

Z1 := E^(-x^2) Cos[x^2 + y^2]
Z2 := 2 - x^2 - y^2

Plot3D[{Z1, Z2}, {x, -1, 1}, {y, -1, 1}, AspectRatio -> 1, 
ViewPoint -> {4, 1, 1}, Filling -> Top, FillingStyle -> Opacity[0.9]]

yields the graph below:

enter image description here

Is there a way I can fill the graph between the two aforementioned 3D surfaces?

Thank you for your time.

J. M.'s missing motivation
  • 124,525
  • 11
  • 401
  • 574
Oliver Spryn
  • 359
  • 4
  • 12
  • @IstvánZachar Thanks, it's fixed now... – Oliver Spryn Nov 20 '12 at 16:57
  • Yes, I do remember now: this is an old bug I've encountered earlier. Simpler version: Plot3D[{1, 2}, {x, 0, 1}, {y, 0, 1}, Filling -> {1 -> {2}}] Sadly, I don't know any workaround. – István Zachar Nov 20 '12 at 17:07
  • @IstvánZachar Just wondering... regarding the Plot3D[{1, 2}... what is the {1, 2} plotting, just 1 and 2 in three space? – Oliver Spryn Nov 20 '12 at 17:11
  • @IstvánZachar Your solution usually works for 2D plots, but doesn't seem to work for 3D. – VLC Nov 20 '12 at 17:13
  • ${x, y}$ planes at $z=1$ and $z=2$. Think of them as constant functions f[x_, y_] := 1 and g[x_, y_] := 2. @VLC: that's why it is a bug. – István Zachar Nov 20 '12 at 17:14
  • @IstvánZachar Ok, so it only works for constants... Thank you anyway. If you want to post your comment as an answer, I'll accept it. – Oliver Spryn Nov 20 '12 at 17:16
  • No, it won't even work for constants. If you check, there is no filling, though there should be. I don't want to post it, as 1) it is not a confirmed bug AFAIK and 2) there might be methods to overcome this issue, e.g. to calculate the space between the two surfaces and plot is as a separate 3D graphics object. – István Zachar Nov 20 '12 at 17:19
  • 3
    should this be listed as a bug (given the comments and answers?) – Mike Honeychurch Nov 20 '12 at 20:46
  • @MikeHoneychurch I know MM9 is due out soon. Perhaps that has been fixed in that edition. – Oliver Spryn Nov 20 '12 at 21:19
  • If anyone has previously reported this as a bug to wolfram maybe that can answer that. When you report bugs you get a message to the effect that you will be contacted later on. I reported bugs in V7 that went unfixed in V8 and have not received any notification about fixes in upcoming V9. So who knows. – Mike Honeychurch Nov 20 '12 at 21:42
  • @IstvánZachar I just revisited this in 10.2, and, indeed Filling->{1->{2}} still doesn't work. – flip Aug 06 '15 at 19:26

4 Answers4

11

How do you like this?

RegionPlot3D[
 2 - x^2 - y^2 > z > E^(-x^2) Cos[x^2 + y^2], {x, -1, 1}, {y, -1, 
  1}, {z, -0.2, 2}, Mesh -> False, AspectRatio -> 1, 
 ViewPoint -> {4, 1, 1}, PlotStyle -> {LightBlue, Opacity[0.8]}]

Mathematica graphics

Sjoerd C. de Vries
  • 65,815
  • 14
  • 188
  • 323
yulinlinyu
  • 4,815
  • 2
  • 29
  • 36
7

As far as I understand the documentation, the following should work:

f[x_, y_] = E^(-x^2) Cos[x^2 + y^2];
g[x_, y_] = 2 - x^2 - y^2;
pic = Plot3D[{f[x, y], g[x, y]}, {x, -1, 1}, {y, -1, 1},
  AspectRatio -> 1, ViewPoint -> {4, 1, 1},
  Filling -> {1 -> {2}}, FillingStyle -> Opacity[0.9]]

enter image description here

The fact that it doesn't looks like a bug to me. The following might be a reasonable workaround:

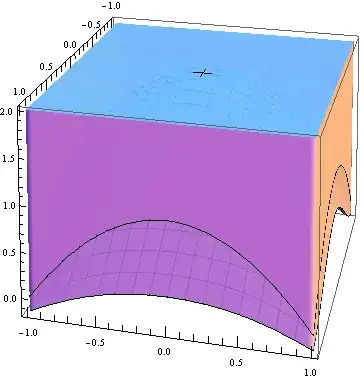
{{a, b}, {c, d}} = {{-1, 1}, {-1, 1}};
dx = (b - a)/80;
dy = (d - c)/80;
fillEdges = Graphics3D[{Opacity[0.9], EdgeForm[],
    Polygon[Join[
      Table[{
        {x, c, f[x, c]}, {x + dx, c, f[x + dx, c]},
        {x + dx, c, g[x + dx, c]}, {x, c, g[x, c]}},
       {x, a, b - dx, dx}],
      Table[Reverse@{
         {x, d, f[x, d]}, {x + dx, d, f[x + dx, d]},
         {x + dx, d, g[x + dx, d]}, {x, d, g[x, d]}},
       {x, a, b - dx, dx}],
      Table[{
        {a, y, f[a, y]}, {a, y + dy, f[a, y + dy]},
        {a, y + dy, g[a, y + dy]}, {a, y, g[a, y]}},
       {y, c, d - dy, dy}],
      Table[{
        {b, y, f[b, y]}, {b, y + dy, f[b, y + dy]},
        {b, y + dy, g[b, y + dy]}, {b, y, g[b, y]}},
       {y, c, d - dy, dy}]
      ]]}];
Show[{pic, fillEdges}]

enter image description here

Mark McClure
  • 32,469
  • 3
  • 103
  • 161
6

This is a rough solution that does what you're looking for:

Z1[x_, y_] := E^(-x^2) Cos[x^2 + y^2]
Z2[x_, y_] := 2 - x^2 - y^2

side1 = Join[Table[{-1, y, Z1[-1, y]}, {y, -1, 1, .1}], 
   Reverse[Table[{-1, y, Z2[-1, y]}, {y, -1, 1, .1}]]];
side2 = Join[Table[{1, y, Z1[1, y]}, {y, -1, 1, .1}], 
   Reverse[Table[{1, y, Z2[1, y]}, {y, -1, 1, .1}]]];
side3 = Join[Table[{x, -1, Z1[x, -1]}, {x, -1, 1, .1}], 
   Reverse[Table[{x, -1, Z2[x, -1]}, {x, -1, 1, .1}]]];
side4 = Join[Table[{x, 1, Z1[x, 1]}, {x, -1, 1, .1}], 
   Reverse[Table[{x, 1, Z2[x, 1]}, {x, -1, 1, .1}]]];

Show[
 Plot3D[{Z1[x, y], Z2[x, y]}, {x, -1, 1}, {y, -1, 1}, 
  AspectRatio -> 1, ViewPoint -> {4, 1, 1}],
 Graphics3D[{Opacity[.9], Polygon[side1], Polygon[side2], Polygon[side3], 
   Polygon[side4]}]
 ]

enter image description here

VLC
  • 9,818
  • 1
  • 31
  • 60
2

I would suggest using ParametricPlot3D to draw the "filling" polygons:

Z1[x_, y_] := E^(-x^2) Cos[x^2 + y^2]
Z2[x_, y_] := 2 - x^2 - y^2

Show[Plot3D[{Z1[x, y], Z2[x, y]}, {x, -1, 1}, {y, -1, 1}],
 ParametricPlot3D[{
   {x, -1, t Z1[x, -1] + (1 - t) Z2[x, -1]},
   {x, 1, t Z1[x, 1] + (1 - t) Z2[x, 1]},
   {-1, x, t Z1[-1, x] + (1 - t) Z2[-1, x]},
   {1, x, t Z1[-1, x] + (1 - t) Z2[1, x]}}
  , {t, 0, 1}, {x, -1, 1}],
 BoxRatios -> Automatic]

enter image description here

Simon Woods
  • 84,945
  • 8
  • 175
  • 324