To my knowledge, as soon as you specify a ColorFunction, every point {x,y} no matter to which function it belongs is colorized by the same function.
If you want to achieve this behavior without modifying built-in functions, you could use the UpValues of an arbitrary symbol, for instance MultiColorFunction. With this, you specify how a plot-command has to be divided into several calls which are then combined with Show. Luckily, we have to do this only once for all plot-commands (I use here only Plot and Plot3D)
MultiColorFunction /: (h : (Plot | Plot3D))[{fs__}, before___,
   MultiColorFunction[cf__], after___] :=
 Show[h[#1, before, ColorFunction -> #2, after] & @@@
   Transpose[{{fs}, {cf}}]]
Now you can simply call
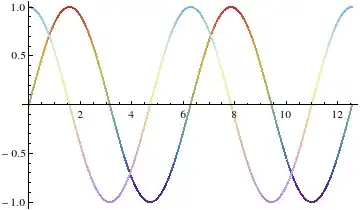
Plot[{Sin@x, Cos@x}, {x, 0, 4 \[Pi]},
  MultiColorFunction["Rainbow", "Pastel"], PlotStyle -> Thick]
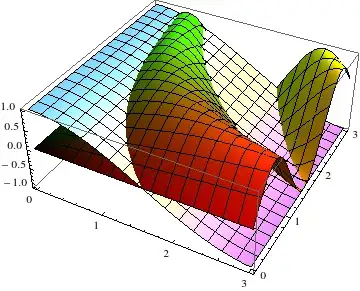
and it works similar for Plot3D
Plot3D[{Sin[x y], Cos[x]}, {x, 0, 3}, {y, 0, 3},
 MultiColorFunction[Function[{x, y, z}, RGBColor[x, y, 0.]], "Pastel"]]
Further notes
Someone might say that when this works, why don't we use TagSet to make it possible to input this as e.g.
Plot[{Sin@x, Cos@x}, {x, 0, 4 \[Pi]}, MultiColorFunction -> {"Rainbow", "Pastel"}]
without actually defining a new option MultiColorFunction. The reason is simple, TagSet only works when the symbol we want to set is in the outer two levels. Therefore, while this
g /: f[g[h[x]]] := "blub"
works, this
h /: f[g[h[x]]] := "blub"
is not possible. Our Plot construct would have the form
Plot[....,Rule[MultiColorFunction,...],..]
so it would be equivalent to h of the example. There is of course an alternative. The last reachable level is the one of Rule but we don't want to change a built-in function. But what, if we don't use the normal Rule but a symbol which only looks like a rule-arrow? Let's try it. A quick check brings up \[RightArrow] which has no built-in meaning and looks perfect. Do you see the difference?

You can input this arrow with EscSpace->Esc and it gets automatically transformed into RightArrow[x,y].
RightArrow /: (h : (Plot | Plot3D))[{fs__}, before___,
     RightArrow[ColorFunction, {cf__}], after___] :=
  Show[h[#1, before, ColorFunction -> #2, after] & @@@
      Transpose[{{fs}, {cf}}]]

Plot[{Sin@x, Cos@x}, {x, 0, 4 \[Pi]},
  ColorFunction\[RightArrow]{"Rainbow", "Pastel"}, PlotStyle ->Thick]


Show. You could combine it withMapThreadto reduce the amount of typing, but that's about it. – rcollyer Dec 13 '12 at 14:12