I am trying to use ColorFunction for 2 functions on the same plot. I only want the cubic equation to change colour.
Plot[{-x^3 + 3.5*x + 0.5, y = 2.9*Tanh[5 x] + 0.3}, {x, -2.5, 2.5},
      PlotRange -> {-3, 3.5}, Axes -> False, Frame -> True, FrameTicks -> None,
      PlotStyle -> {{Darker[Green], Thick}, {Blue, Thick}},
      ColorFunction -> Function[{x, y}, If[x > 1, Red, Black]],
      ColorFunctionScaling -> False, PlotStyle -> Thick]
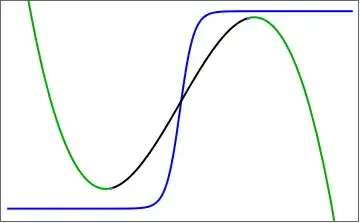
This is what the code above produces:

This is ideally how i would like it to be displayed. Is this possible in Mathematica without using the drawing tool?


Show[plot1, plot2]where each plot has only one function with the corresponding options. – b.gates.you.know.what Feb 15 '14 at 22:40