The answer by Mr. Wizard covers the built-in options, but one thing that you may be missing is that the tooltip alone isn't very convenient when it comes to recording the desired coordinates for later use. You'd have to read off the numbers and type them in again.
If you want to automate this process too, then you might be interested in the following:
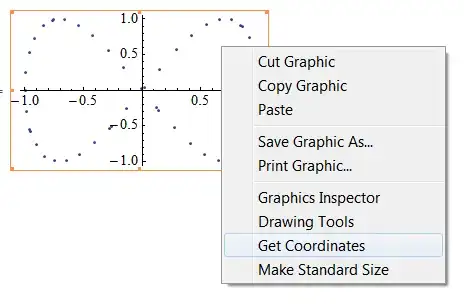
data = Table[{Cos[n], Cos[2 n]}, {n, 50}];
ListPlot[Tooltip[data]] /.
 Tooltip[x__] :> PopupWindow[Tooltip[x], Last[{x}]]
Here I appended a replacement rule to the ListPlot that attaches a PopupWindow to every single instance of a Tooltip that is found in the graphic. Since a separate Tooltip automatically wraps each generated point in the plot, we will now also get a PopupWindow for every point. The contents of the window is set to be the same as the tool tip content:

The window pops up when you click on the point of interest. From this window, you can textually copy the desired coordinate.
By the way, I put together a list of other coordinate-picking options here quite some time ago.
Edit
To make this post-processing really easy, just define a rule:
toolRule = Tooltip[x__] :> PopupWindow[Tooltip[x], Last[{x}]];
and apply it to any plot with Tooltips as
ListPlot[Tooltip[...]]/.toolRule
It's important to remember that ListPlot accepts lists of lists as argument, in order to plot separate point sets. My method works without change for that case, e.g., try
data2 = Table[{Cos[n], Cos[2 n]}, {n, 50}];
ListPlot[Tooltip[{data, data2}]] /. toolRule
In fact, it works for any expression containing Tooltips.
Edit 2
This solution is more robust than the one by kguler which relies on an undocumented feature apparently present only in ListPlot, which moreover has to be applied in different ways depending on the structure of the plot argument.
To illustrate the robustness, take a completely different example:
ContourPlot[
  1/(1 + Cos[x - 1]^20) - 1/(1 + Cos[(y - 1)^2 + x^2]^20), {x, -2,
   2}, {y, -2, 2}, ColorFunction -> ColorData["Rainbow"],
  Contours -> {-.25, -.31, -.15, .1, .28, .38, .45},
  PlotPoints -> 80] /. toolRule
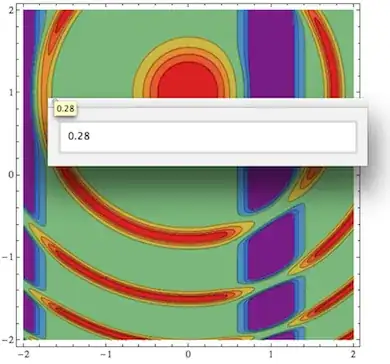
Without making any changes to my answer whatsoever, I can use it to copy the contour values in this ContourPlot exactly the same way I did for the coordinates in the ListPlot, again leveraging the built-in Tooltip mapping done behind the scenes.
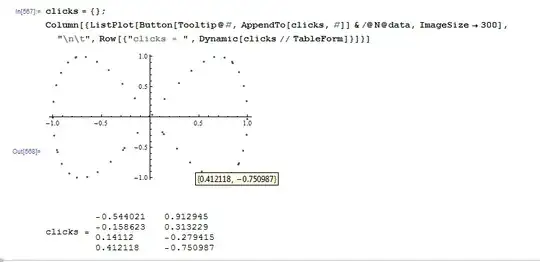
Edit 3: accumulating clicked points on the clipboard
I thought of another interesting extension of the above rule-based post-processing:
Click any number of points with a Tooltip, and get their coordinates as a list on the clipboard.
Here's how that can be done. The rule is defined first, then I show an example (you can change the name of the rule to something more cool, I was just... fooling around):
toolSpoolRule = Tooltip[t__] :> Button[Tooltip[t], CopyToClipboard[
First@
Append[Cases[NotebookGet[ClipboardNotebook[]],
TooltipBox[x_, "\"Clicked Points\"", ___] :>
Tooltip[Append[ToExpression[x], Last[{t}]],
"Clicked Points"], Infinity],
Tooltip[{Last[{t}]}, "Clicked Points"]]
]];
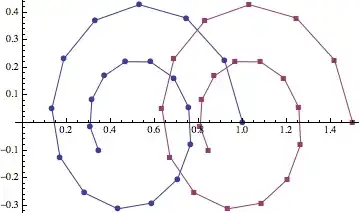
ListPlot[Tooltip@
Evaluate[
Table[N@Table[
p + Exp[-t/10] {Cos[t], Sin[t]}/2, {t, 0, 10, .5}], {p, {{.5,
0}, {1, 0}}}]], Joined -> True,
PlotMarkers -> Automatic] /. toolSpoolRule
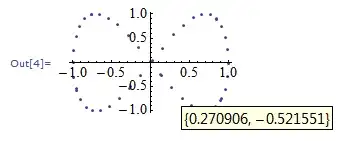
Now click a bunch of points - nothing visible happens, except that the contents of your clipboard is silently growing. When you're done, press the paste keys, and you'll get something like this:
{{0.530442,0.429276},{0.329644,0.372235},{0.188034,0.233045},{1.5,0.}}
This gives you the freedom to insert the data you just collected at a location of your choosing.
Clearly this rule definition is more complex, but one nice thing about all these rules is that you define them only once. Then at a later point, you can apply them to any existing plots you may already have (as long as they use Tooltip), and make them interactive. The ability to do this without having to regenerate the plot can be quite useful if it takes a lot of computation to do so. And if you want popup windows instead of clipboard storage, just change the rule back to toolRule.


Printmethod doesn't work in version 7: it prints to the Messages window which is why I had to resort toNotebookWrite. – Mr.Wizard Dec 25 '12 at 11:06Buttonfunction intoDateListPlotinstead ofListPlotand don't work. Some clue?Tooltipworked nice. – Murta Dec 25 '12 at 13:09/.) methods should still work. – Mr.Wizard Dec 25 '12 at 13:40--Plotfuntions; this seems to work only withListPlot. – kglr Dec 25 '12 at 14:33DateListPlotinto aListPlot. Not so nice, but worked :) tks – Murta Dec 25 '12 at 14:35ListPlotwith one data set. Try it with two sets, as in{data1, data2}and it doesn't seem to produce anything useful. – Jens Dec 25 '12 at 17:00PopupWindowandButtonwork fine withListPlotwith multiple data sets, provided you add the extra layer ofMapto push the wrapper to the level of individual data elements. Try, for example,ListPlot[Button[Tooltip@#, Print[#]] & /@ # & /@ {N@data1, N@data2}]orListPlot[PopupWindow[Tooltip@#, #] & /@ # & /@ {N@data1, N@data2}](Windows Vista 64b, version 9; haven't checked if it works the same way in version 8.0.4) – kglr Dec 25 '12 at 20:03Mapin different ways depending on the plot argument, whereas my rule works equally in all cases, without requiringMapat all (instead leveraging the internal mapping done byTooltip). – Jens Dec 25 '12 at 20:12TooltipbyPopupWindow[Tooltip@#, #]&in the standard commandListPlot[Tooltip[{data1, data2}]]. But that does not work. So maybe you should change the bold-face title because you're not really using a wrapper around all the data, as one would expect forTooltip. – Jens Dec 25 '12 at 20:42Mapped (.../@) to data even with a single data set. And, regarding "... not really using a wrapper around all the data": correct, but this is never claimed/implied anywhere in my post... Besides, wrappers can be "on individual data, datasets or collection of datasets" and not all wrappers are used "as one would expect forTooltip". – kglr Dec 25 '12 at 22:53