4

The attchd graphics called chromograms represent a set of discrete-state, continuous-time - ie, discrete-event signals, generated with Mathematica 9 on OSX with a Cinema display.

• Top 2 rows are independent signals.

• Bottom two chromograms (red and green) shows the segments where the top 2 rows agree (green) in their temporal coding, and where they differ (red).

So each Rectangle's left and right positions are encoded by 2 timestamps (even-begin and event-end).

X axis is the timeline in seconds, and this graphic shows [200,400] window.

enter image description here

The problem: note there are 3 red rectangles (bottom row) that have no corresponding "holes" in the complementary green signal. This is an error in Mathematica's graphics rendering because closer inspection reveals the holes to be there.

The problem becomes extreme when zooming out to graph a larger time window. In the next figure the same data is shown for the window [0,1800]:

enter image description here

In such a stiff-scale graphic, there are many more instances of the above problem - again, closer inspection shows that the red and green event-signals partition the time-axis so red and green Rectangles should never overlap.

The problem is unrelated to choice of colors - flipping red and green still shows the upper signal to be problematic.

So it seems Rectangles are rendered "too thick" and overlap where they shouldn't.

Are there any Options or methods one could use to control this issue? (Potentially generating a complementary set of interval events and actively rendering them in White may work but haven't tested this and would be a hack in any case).

whuber
  • 20,544
  • 2
  • 59
  • 111
alancalvitti
  • 15,143
  • 3
  • 27
  • 92
  • Are you using MMA 9 or an earlier version? – whuber Apr 02 '13 at 19:03
  • MMA 9, thanks, will edit that in. – alancalvitti Apr 02 '13 at 19:04
  • I asked because this phenomenon was noted a couple of weeks ago in a question here; it does not appear in earlier versions. – whuber Apr 02 '13 at 19:05
  • Can you link the Q please? – alancalvitti Apr 02 '13 at 19:06
  • Are you sure this isn't an aliasing problem? After all, your screen only has so many pixels, if you are trying to represent data that is finer than the pixel resolution, the display has no choice but to approximate. You can see by trying larger ImageSizes or by plotting smaller portions of the data. – bill s Apr 02 '13 at 19:29
  • Here's the related question: http://mathematica.stackexchange.com/questions/20909/how-can-pixelconstrained-be-emulated-with-densityhistogram. See the comment thread to the question. – whuber Apr 02 '13 at 19:36
  • I drew a bunch of rectangles like the images in question and could not reproduce the problem in MMA 8.0.0: I think this may be the same issue noted in the related question. 
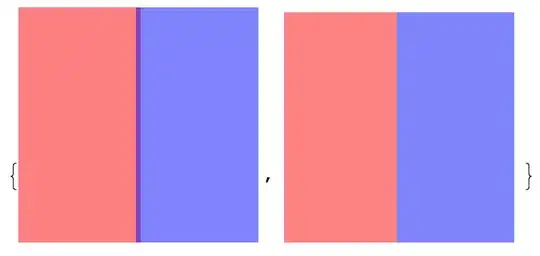
x = Range[1920]; red = RandomSample[x, 500]; green = Complement[x, red]; With[{h = 200}, Graphics[{Green, Rectangle[{#, 0}, {# + 1, h}] & /@ green, Red, Rectangle[{#, h}, {# + 1, 2 h}] & /@ red}]] – whuber Apr 02 '13 at 19:44
  • @whuber Using your code on Win7-64 and v9 I can't see problems either. As far as I can see, every red rectangle has a same-sized white neighbor in the green bar. – Sjoerd C. de Vries Apr 02 '13 at 20:23
  • @whuber, running your code in MMA9 OSX 10.6.8 + Cinema display I see a single green rectangle (the red ones appear ok). At 200% magnification, I see 2 green rectangles separated by a single thin margin. At 300% mag, I see 4 green rectangles separated by 3 thin margins. – alancalvitti Apr 02 '13 at 21:16
  • 1
    @bills, seems a MMA9/OSX issue. – alancalvitti Apr 02 '13 at 21:17
  • In Mac, adding Antialiasing -> True should help:

    With[{h = 200}, Graphics[{Antialiasing -> True, Green, Rectangle[{#, 0}, {# + 1., h}] & /@ green, Red, Rectangle[{#, h}, {# + 1., 2 h}] & /@ red}]]

    – MinHsuan Peng Apr 03 '13 at 18:45
  • 1
    @MinHsuanPeng, that appears to solve it. If you post it as an answer I'll accept it. Interesting that (1) Antialiasing is a graphics primitive, not an Option, and (2) Wolfram tech support isn't aware of this. – alancalvitti Apr 03 '13 at 21:12
  • I see the 1px overlap on OS X both in v9 and v8. In v9 there problem is always present, in v8 only at certain graphics sizes. Graphics[{EdgeForm[None], Opacity[.5], Red, Rectangle[{0, 0}, {.5, 1}], Blue, Rectangle[{.5, 0}, {1, 1}]}] // Rasterize – Szabolcs Apr 04 '13 at 01:59
  • Yes, this is a Mac-only issue. I finally found the related questions this and this. I voted to close as duplicate. – Szabolcs Apr 04 '13 at 02:03
  • @Szabolcs Those questions were about the mesh being visible. I don't immediately see how that relates to this question. – Sjoerd C. de Vries Apr 04 '13 at 05:36
  • @SjoerdC.deVries The reason why the mesh is visible is that the polygons are transparent and they overlap by a pixel or so. It's exactly the same thing we see here: the rectangles can be a pixel bigger than they should be. – Szabolcs Apr 04 '13 at 13:49
  • 2
    Why are people downvoting this? This is a valid question with a non-obvious (I'd even say: unexpected) solution. Also, @alancalvitti can you test my solution and confirm that we can close this as a duplicate? In my tests it solves the rectangle overlapping problem, but of course it would be much better if you could post some test code so people can try it out without too much hassle. – Szabolcs Apr 04 '13 at 13:54
  • @Szabolcs Ah, I see. – Sjoerd C. de Vries Apr 04 '13 at 14:24

1 Answers1

5

This is a Mac-only issue and it's present in earlier versions too (not just 9), though with rectangles it manifests itself less commonly in v8 than in v9. To solve the problem, use the option Method -> {"TransparentPolygonMesh" -> True} in Graphics to get rid of this problem. It will also disable antialiasing.

Posts with the same problem, appearing in a different form:

The reason why the mesh appears in those questions is that the polygons are transparent and they overlap slightly (by a pixel or so).


Test code:

g = Graphics[{Opacity[.5], Red, Rectangle[{0, 0}, {.5, 1}], Blue, 
   Rectangle[{.5, 0}, {1, 1}]}]

Magnify[#, 4] & /@ {Rasterize[g, "Image", ImageSize -> 50], 
  Rasterize[Show[g, Method -> {"TransparentPolygonMesh" -> True}], 
   "Image", ImageSize -> 50]}

enter image description here

Szabolcs
  • 234,956
  • 30
  • 623
  • 1,263