I've programmed drawing tools for graph images and am experiencing a problem with the coordinates of an Ellipse on a graph with a Log Y axis.
It's quite easy to work out the Y Axis coordinates for other primitive objects such as Line, Rectangle & etc:
y1 = ((viewHeight - stPoint.Y + topMargin) / (viewHeight) * (maxY - minY) + minY);
y2 = ((viewHeight - endPoint.Y + topMargin) / (viewHeight) * (maxY - minY) + minY);

if (isLogYAxis)
{
   y1 = Math.Exp(y1);
   y2 = Math.Exp(y2);
}
Here is an example showing the Epilog generated for a Circle and a Rectangle I've drawn:
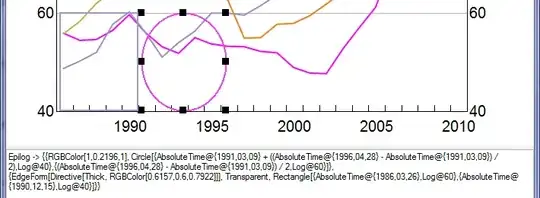
Epilog -> {{RGBColor[1,0.2196,1], Circle[{AbsoluteTime@{1991,03,09} + ((AbsoluteTime@{1996,04,28} - AbsoluteTime@{1991,03,09}) / 2),Log@40},
{(AbsoluteTime@{1996,04,28} - AbsoluteTime@{1991,03,09}) / 2,Log@60}]},

{EdgeForm[Directive[Thick, RGBColor[0.6157,0.6,0.7922]]], Transparent, Rectangle[{AbsoluteTime@{1986,03,26},Log@60},{AbsoluteTime@{1990,12,15},Log@40}]}}
When I execute this command the Ellipse's Y axis is out of proportion, see:

I want to be able to plug in Log@40 and Log@60 for both the Rectangle and Circle and get the same results.
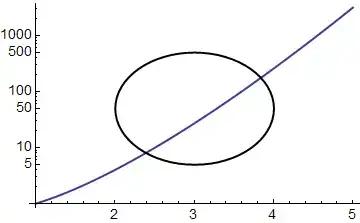
I've made a basic example to demonstrate this.
LogPlot[x^x, {x, 1, 5},
 Epilog -> {{RGBColor[0, 0, 0],
    Circle[{2, Log@46.20}, {1, Log@50.9972}]}}]
Seeing the radius from the ellipse's centre to its top (2000) will be a different size from its centre to its bottom (approx 50), is it even possible to draw a Ellipse on a LogY Graph as I've described?

Edit:
@Artes thank you for pointing me in the right direction, I've tried all sorts of things using this formula Plot[Exp[y /. Solve[x^2 + y^2 == 1, y]], {x, -1, 1}] without luck.
In the last screenshot I've put red squares around the Log@46.20 and Log@50.9972 does anybody know what formula's I would have to change these too in order to get a circle with Log Height of about 5?
If it makes any difference I have the MinY and MaxY Log scale:
MinY = 3.6888794541139363
MaxY = 4.941642422609304

Plot[Exp[y /. Solve[x^2 + y^2 == 1, y]], {x, -1, 1}]. Related question: How does one set a logarithmic scale in a ContourPlot? – Artes Jun 17 '13 at 00:08