30

I have a ListlinePlot function, that I would like to combine with both a Graphics3D plot and a ListPointPlot3D plot, in such a way that the ListLinePlot is the bottom of the 3D boundary cube for the 3D plots. Can this be done in Mathematica 8.0.4?

Obviously the code below fails to combine the plots in Show, but is there another way to accomplish this? Thanks!

    Needs["TetGenLink`"]
twodPts = RandomReal[{-1, 1}, {10, 2}];
threedPts = RandomReal[{-1, 1}, {50, 3}];
{pts, surface} = TetGenConvexHull[threedPts];

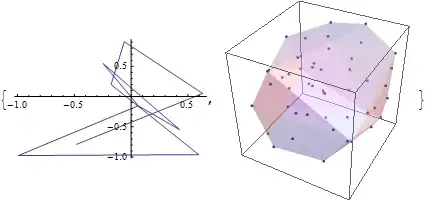
twoDptsPlot = ListLinePlot[twodPts, ImageSize -> {200, 200}];
threeDPtsPlot = ListPointPlot3D[threedPts, ImageSize -> {200, 200}];
surfacePlot = 
  Graphics3D[{EdgeForm[], Opacity[0.3], 
    GraphicsComplex[pts, Polygon[surface]], ImageSize -> {200, 200}}];

{twoDptsPlot, 
 Show[threeDPtsPlot, surfacePlot, ImageSize -> {200, 200}, 
  BoxRatios -> 1, Axes -> False]}
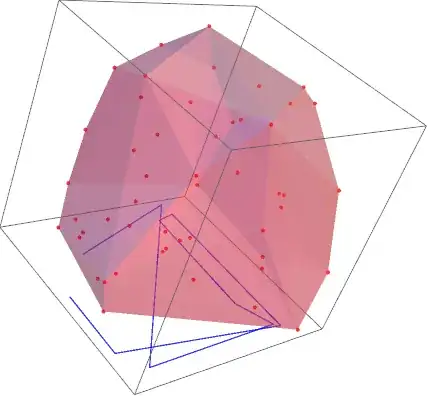
Mathematica graphics

István Zachar
  • 47,032
  • 20
  • 143
  • 291
Nothingtoseehere
  • 4,518
  • 2
  • 30
  • 58

4 Answers4

27

The following is probably what you want.

Make3d[plot_, height_, opacity_] := 
  Module[{newplot},
    newplot = First@Graphics[plot]; 
    newplot = N@newplot /. {x_?AtomQ, y_?AtomQ} :> {x, y, height};
    newplot /. GraphicsComplex[xx__] :> {Opacity[opacity], GraphicsComplex[xx]}
  ]

Show[{Graphics3D[Make3d[twoDptsPlot, -1, .75]], threeDPtsPlot,surfacePlot}, Axes -> True]

which gives enter image description here

This function can takes any 2D plot and place it on a 3D box with a specified height. I got this trick in the web few years back but now cant remember the reference. Hope this helps you.

Mr.Wizard
  • 271,378
  • 34
  • 587
  • 1,371
PlatoManiac
  • 14,723
  • 2
  • 42
  • 74
  • 2
    I saw the method in this a while ago. http://mathgis.blogspot.com/2009/02/howto-display-2d-plot-in-3d.html – Ajasja Mar 29 '12 at 14:10
  • @Ajasja You are right this is the link I was looking for.. – PlatoManiac Mar 29 '12 at 14:17
  • @PlatoManiac Make3d[plot_, height_, opacity_] does not respect the colour of plot_ when this made by Graphics, for example: s = Graphics[Polygon[{{0, 0}, {1, 1}, {0, 1}, {1, 0}}], BaseStyle -> Red]

    Show[{Graphics3D[Make3d[s, 0, 100.8]]}, Axes -> False, Boxed -> False] what can I do to stick to the original colour?

    – Mencia Jun 17 '15 at 20:42
  • @Mr.Wizard♦ any idea on my comment just above ? – Mencia Jun 18 '15 at 09:59
  • 1
    @Mencia Sjoerd's Texture method is probably easiest if you want a complete image of the 2D plot with all options considered. (You can rasterize at a higher resolution of the texture quality is not as good as you would like.) Otherwise I would suggest manually adding specific handling for BaseStyle and anything else you want, perhaps Prolog and Epilog, Background, etc. If you have trouble extracting and integrating these option values let me know. – Mr.Wizard Jun 19 '15 at 03:24
13

You explicitly ask for the ListLinePlot to be placed in the Graphics3D, not just the lines contained in the plot. Since none of the answers so far do that here is my version.

surfacePlot = 
 Graphics3D[{EdgeForm[], {Texture[twoDptsPlot], 
    Polygon[{{-1, -1, -1}, {1, -1, -1}, {1, 1, -1}, {-1, 1, -1}}, 
     VertexTextureCoordinates -> {{0, 0}, {1, 0}, {1, 1}, {0, 1}}]}, 
     {Opacity[0.3], GraphicsComplex[pts, Polygon[surface]]}}, 
   ImageSize -> 400, 
   Lighting -> "Neutral"]

Show[surfacePlot, threeDPtsPlot, Axes -> False]

Mathematica graphics

Sjoerd C. de Vries
  • 65,815
  • 14
  • 188
  • 323
  • This looks like a cool approach @Sjoerd C. de Vries, thanks for the great code! – Nothingtoseehere Mar 29 '12 at 22:23
  • 2
    Might want to use Texture[ImageData[Rasterize[twoDptsPlot, Background -> None]]] if you need the texture to have transparency. – Brett Champion Mar 30 '12 at 02:28
  • @Sjoerd C. de Vries @Mr.Wizard♦ I am trying to use this method. But I would like to combine the ListLinePlot with a ListPlot3D. I am trying this: surfacePlot = Graphics3D[{ EdgeForm[], {Texture[twoDptsPlot], Polygon[{{-1, -1, -1}, {1, -1, -1}, {1, 1, -1}, {-1, 1, -1}}, VertexTextureCoordinates -> {{0, 0}, {1, 0}, {1, 1}, {0, 1}}]} , ListPlot3D[{{1, 4, 2}, {6, 3, 9}, {1, 9, 4}}]}, ImageSize -> 400, Lighting -> "Neutral"] but it doesn't work. Any suggestion? – Mencia Jun 21 '15 at 16:12
9

This is an approach that uses the graphics primitive Line.

Needs["TetGenLink`"]
twodPts = Transpose[{RandomReal[{-1, 1}, {10}], RandomReal[{-1, 1}, {10}], 
    Table[-1, {10}]}];
threedPts = RandomReal[{-1, 1}, {50, 3}];
{pts, surface} = TetGenConvexHull[threedPts];
twoDptsPlot = Graphics3D[Line[twodPts], PlotRange -> {{-1, 1}, {-1, 1}, {-1, 1}},
    ImageSize -> {200, 200}];
threeDPtsPlot = ListPointPlot3D[threedPts, PlotRange -> {{-1, 1}, {-1, 1}, {-1, 1}},
    ImageSize -> {200, 200}];
surfacePlot = Graphics3D[{EdgeForm[], Opacity[0.3], GraphicsComplex[pts, Polygon[surface]],
    PlotRange -> {{-1, 1}, {-1, 1}, {-1, 1}},
    ImageSize -> {200, 200}}];
Show[threeDPtsPlot, surfacePlot, twoDptsPlot, ImageSize -> {200, 200},
    BoxRatios -> 1, Axes -> False]

enter image description here

VLC
  • 9,818
  • 1
  • 31
  • 60
6

Just in case using a single Graphics3D may be of interest:

Graphics3D[{
  PointSize[.01], Red, Point /@ threedPts, 
  Blue, Thickness[.003], Line@(Insert[#, -1, -1] & /@ twodPts), 
  GraphicsComplex[pts, {EdgeForm[], FaceForm[{Pink, Opacity[0.4]}], Polygon[surface]}], 
  ImageSize -> {200, 200}
}]

gives

enter image description here

Mr.Wizard
  • 271,378
  • 34
  • 587
  • 1,371
kglr
  • 394,356
  • 18
  • 477
  • 896