13

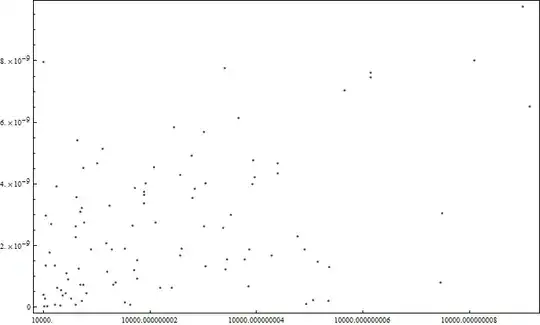
In my problem, I need to plot a figure in a relatively small region of the $x$ axis, e.g.,

 ListPlot[{RandomReal[#] + 10^4, 
   RandomReal[#]} & /@ (Range[100] 10^-10), Frame -> True, Axes -> False]

and the figure is displayed properly, but all the tick marks have the same label:

Mathematica graphics

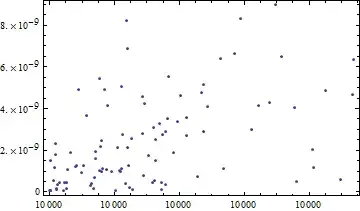
Is there any clever way to get rid of this problem?

Szabolcs
  • 234,956
  • 30
  • 623
  • 1,263
yulinlinyu
  • 4,815
  • 2
  • 29
  • 36
  • 2
    欢迎来到Mathematica.SE! :-) Don't worry about image uploading, you'll soon have enough reputation to do it. Until then we'll help you. Please make sure to include the question in the body of the post as well (not only in the title). A little redundancy doens't help – Szabolcs May 07 '12 at 13:44
  • Oh great! I think U know well about Chinese language, SZabolcs. – yulinlinyu May 11 '12 at 01:26

2 Answers2

15

You can define your own function for FrameTicks :

ticks[min_, max_] := {#, NumberForm[#, 20]} & /@ 
  N[FindDivisions[{min, max}, 5]]

ListPlot[{RandomReal[#] + 10^4, 
    RandomReal[#]} & /@ (Range[100] 10^-10), Frame -> True, 
 FrameTicks -> {{Automatic, None}, {ticks, None}}]

Mathematica graphics

Just choose your own preferred presentation format of the given values...

ticks[min_, max_] := {#, Grid[{{min}, {"+"}, {# - min}}]} & /@ 
  N[FindDivisions[{min, max}, 5]]

ListPlot[{RandomReal[#] + 10^4, 
    RandomReal[#]} & /@ (Range[100] 10^-10), Frame -> True, 
 FrameTicks -> {{Automatic, None}, {ticks, None}},FrameStyle->Medium]

Mathematica graphics

Yves Klett
  • 15,383
  • 5
  • 57
  • 124
7
ListPlot[{RandomReal[#] + 10^4, RandomReal[#]} & /@ (Range[100] 10^-10), Frame -> True, 
          Axes -> False, FrameLabel -> {"x - 10^4", "y"}] /. 
          List[x_, y_] /; x > 10000 -> List[x - 10000, y]

enter image description here

Dr. belisarius
  • 115,881
  • 13
  • 203
  • 453