Bug introduced in 10.0.0 and fixed in 10.0.1
The Plot option GridLines can be specified either as a list of explicit values at which to draw the lines, or as a function that calculates the grid lines based on the maximum and minimum values along each axis. In Mathematica version 8, I was able to specify this function for GridLines in two equivalent ways:
Clear[gridLineFunction];
gridLineFunction[xmin_, xmax_] := {.1, .2, .5};

Plot[Sin[x], {x, 0, 1}, GridLines -> gridLineFunction]

This follows the example in the documentation, but for simplicity it returns a fixed list of numbers without doing any calculations at all. However, now I rewrite the above by passing it directly to GridLines as a Function:
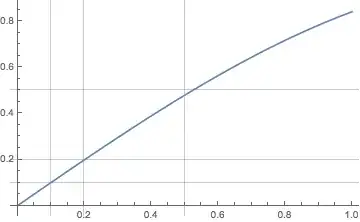
Plot[Sin[x], {x, 0, 1},
 GridLines -> Function[{xmin, xmax}, {.1, .2, .5}]]

This last line is what I get in version 10 on OS X. It used to work in version 8. And the equivalent construct still works for the Ticks option:
Plot[Sin[x], {x, 0, 1}, Ticks -> Function[{xmin, xmax}, {.1, .2, .5}]]

Is there any reason I'm overlooking why this Function approach no longer works in GridLines, or is this a bug?
GridLines -> Function[...]gives this. Looks like a bug in v.10.0.0. – Alexey Popkov Jul 11 '14 at 19:14