27

A very common feature of graphs of functions used throughout textbooks are simple indications, such as open circles, of the points at which a function is undefined. Is there a way to do this in Mathematica?

I understand that I can use Epilog (or Prolog, or other explicit drawing graphics functions) to "manually" draw these elements, but us there a way to automatically do this, or at least return the coordinates of such points for use as arguments to Epilog?
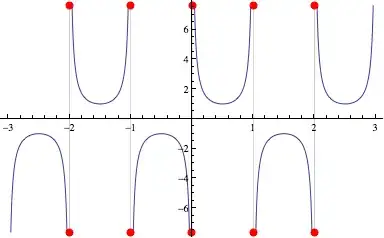
orome
  • 12,819
  • 3
  • 52
  • 100

2 Answers2

24

By using Exclusions and ExclusionsStyle like this

Plot[1/Sin[π x], {x, -3, 3},
  Exclusions -> Sin[π x] == 0, 
  ExclusionsStyle -> {Thin, Directive[Red, PointSize[0.02]]}
]

you can define the location of the discontinuities and the style for poles and discontinuity boundaries, respectively.

Exclusionsstyle example image

Also the Wolfram Blog, March 2011 has more examples on this topic.

Michael E2
  • 235,386
  • 17
  • 334
  • 747
Thies Heidecke
  • 8,814
  • 34
  • 44
16

You can use the ExclusionsStyle option to control how Mathematica renders regions excluded from the Plot.

Edit Doing something like ExclusionsStyle -> {None, {{Black, PointSize[Large]}}} will put a large point at the excluded points. For example, modifying a function from the help documentation:

Mathematica graphics

Michael E2
  • 235,386
  • 17
  • 334
  • 747
Eli Lansey
  • 7,499
  • 3
  • 36
  • 73
  • As near as I can tell, that simply changes how that segment of the graph is drawn (e.g. by omitting a single pixel in the figure), and provides no way to "exaggerate" the relevant points so they can be clearly seen. – orome Jan 17 '12 at 21:36
  • I've updated with another option. The second entry in that options list sets the boundary style for the exclusion. – Eli Lansey Jan 17 '12 at 21:38