I believe this is what you want?
ListLinePlot[
  {{0, 0}, {1, 2}, {3, 4}, {4, 2}, {6, 0}},
  InterpolationOrder -> 0,
  Frame -> True
] /. Line[x : {{_, _} ..}] :> (Line /@ Partition[x, 2])
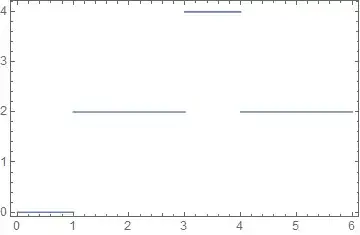
Post-processing of the Graphics expression generated by ListLinePlot is used in the form of ReplaceAll. The Line is split into pairs of points using Partition, avoiding the drawing of vertical connecting segments.
Post-processing is a quick way to hack out a solution to a lot of plotting problems and it lets you work with the full range of e.g. ListLinePlot options. However it can also be slow and fragile. In the case above every Line expression is modified whether it originates from the plot itself or for example an Epilog option. I do in practice use post-processing and at times it can be the best solution. However often it is more robust and performs better to construct your own plotting function using Graphics directly. Here is a simple example:
myPlot[dat : {{_, _} ..}, opts : OptionsPattern[Graphics]] :=
  Module[{rhold},
    rhold[{{x_, y_}, {X_, Y_}}] := {{x, y}, {X, y}};
    Graphics[Line[ rhold /@ Partition[dat, 2, 1] ], opts]
  ]
And its use:
myPlot[{{0, 0}, {1, 2}, {3, 4}, {4, 2}, {6, 0}},
  BaseStyle -> {Red, AbsoluteThickness[2]},
  Frame -> True]

You can create custom Options for your plot function to further customize its syntax. See:


