9

Is there a convenient way to format tick labels? In this example I would like to use the default Mathematica tick intervals, but simply convert the X axis labels to strings with "s" added.

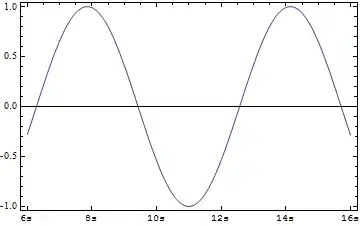
As you can see below, by default Mathematica shows six X axis labels, with three subticks, although for different plot ranges both can vary:

plotA = Plot[Sin[x], {x, 6, 16}, Frame -> True]

enter image description here

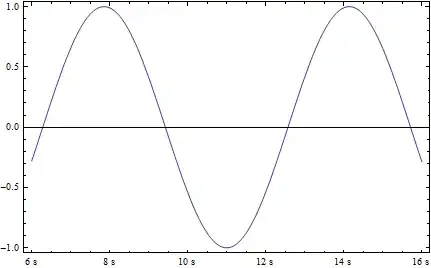
A basic function can be defined to add the "s" formatting, but it doesn't vary as the Mathematica range would. Adding subticks would be further work, and the upper X frame would have to be defined too, to match the intervals.

frametickfunction[xmin_, xmax_] :=
 {#, ToString[#] <> "s"} & /@ FindDivisions[{xmin, xmax}, 6]

plotB = Plot[Sin[x], {x, 6, 16}, Frame -> True,
 FrameTicks -> {{True, True}, {frametickfunction, True}}]

enter image description here

It would be convenient if I could obtain the X axis specification produced in plotA, modify it, and use it in plotB. Is this possible, or are there other methods?

Chris Degnen
  • 30,927
  • 2
  • 54
  • 108

2 Answers2

8

as J. M. said , you have to use AbsoluteOptions

plotA = Plot[Sin[x], {x, 6, 16}, Frame -> True];

newTicks = AbsoluteOptions[plotA, FrameTicks][[1, 2,  1]] /. 
{x1_, x2_, x3_, x4_} /; x1 == x2 :> {x1, ToString[Floor@x2] <> " s", x3, x4}

 Plot[Sin[x], {x, 6, 16}, Frame -> True, 
 FrameTicks -> {{Automatic,Automatic}, {newTicks, Automatic}}]

enter image description here

Edit

for some reason the tick size is different

newTicks = AbsoluteOptions[plotA, FrameTicks][[1, 2, 1]] /. 
 {x1_, x2_, x3_, x4_} -> {x1, x2, {0.00625`, 0.`}, x4} /. 
 {x1_, x2_, x3_, x4_} /;x1 == x2 :> {x1, ToString[Floor@x2] <> " s", {0.01, 0}, x4}; 

Plot[Sin[x], {x, 6, 16}, Frame -> True, 
FrameTicks -> {{Automatic, Automatic}, {newTicks, Automatic}}]

enter image description here

FDSg
  • 1,805
  • 1
  • 17
  • 17
  • 1
    "for some reason the tick size is different" - that's what I was alluding to in my comment; AbsoluteOptions[] doesn't precisely return the sort of ticks used. – J. M.'s missing motivation Jun 15 '12 at 16:31
  • 4
    Does anyone know if it is possible, in some way, perhaps undocumented, to specify a tick length in printers points rather than scaled length -- without doing calculations for the conversion. It would be useful if that were possible. – Mike Honeychurch Jun 15 '12 at 23:08
5

This method is based on Mr. Wizard's answer (updated for V10) to About the number format in ticks, which I discovered investigating another question, Change only tick labels while keeping default ticks, that in meantime was marked as a duplicate of this one. Since the method presented in the accepted answer by FDSg no longer works (currently the only other answer), I'd like to present my solution here to both problems.

Labeling function for Ticks and FrameTicks. (Thanks to Mr.Wizard for the suggestion for autolabel and noting that the tick divisions of Charting`ScaledTicks do not match the front end's behavior for Automatic. Setting the divisions to {5, 5} seems to do the trick. The default for Charting`ScaledTicks is {6, 6}.)

autolabel[labelfn_] := 
 labelfn /@ Charting`ScaledTicks[{Identity, Identity}][#1, #2, {5, 5}] &

2D frame ticks (Chris Degnan's problem):

framelabel[{x0_, label : Except[_Spacer], {plen_, mlen_}, style_}] :=
  {x0, Row[{label, "s"}, "\[ThinSpace]"], {plen, mlen}, style};
framelabel[tick_] := tick;

plotB = Plot[Sin[x], {x, 6, 16}, Frame -> True, 
  FrameTicks -> {
    {True, True},
    {autolabel[framelabel], True}}]

Mathematica graphics

Plot3D ticks (from duplicate question):

mylabelx[{x0_, label : Except[_Spacer], {plen_, mlen_}, style_}] :=
  {x0, Row[{label, "mm"}, "\[ThinSpace]"], {plen, mlen}, style};
mylabelx[tick_] := tick;
mylabely[{x0_, label : Except[_Spacer], {plen_, mlen_}, style_}] :=
  {x0, Row[{label, "cm"}, "\[ThinSpace]"], {plen, mlen}, style};
mylabely[tick_] := tick;

Plot3D[Sin[x + y^2], {x, -3, 3}, {y, -2, 2}, 
 Ticks -> {autolabel[mylabelx], autolabel[mylabely], Automatic}]

Mathematica graphics

Caveat: As with @FDSg's solution, this will probably change when (and if) ticks are redone again. At that point someone else may be able to update with another workaround.

Michael E2
  • 235,386
  • 17
  • 334
  • 747
  • I was thinking about posting an answer using this method. You get a +1 for it. However I noted that the ticks are not quite the same which gave me pause. Rather than having to pass mylabelx /@ Charting`ScaledTicks[{Identity, Identity}][##] & to Plot I think an abstraction would be helpful; why not something like autoLabel[mylabelx] in its place? – Mr.Wizard Jul 01 '15 at 16:34
  • @Mr.Wizard Thanks, that would be cleaner (see update). A minor reservation, imo, is that having to type out internal functions when you use them, reminds you of a place the code might be broken when using a future version. – Michael E2 Jul 01 '15 at 17:14
  • 1
    To the contrary I prefer the idea of making it an abstraction with the plan to fix the underlying implementation should undocumented functions change. This way you only need one code patch rather than manifold! – Mr.Wizard Jul 01 '15 at 17:43
  • @Mr.Wizard I see. Well, your reason trumps mine. Thanks. – Michael E2 Jul 01 '15 at 18:37
  • Hmm, it looks like this doesn't work on my system 12.1.1 for Linux x86 (64-bit) (June 19, 2020). For plotB I just get the normal labels, no s's appended onto the labels. – Tanner Legvold Nov 19 '20 at 01:12
  • Ahh, it looks like the style_ part of the first framelabel definition doesn't appear now for this particular example. I fixed it by inserting this additional framelabel definition framelabel[{x0_, label : Except[_Spacer], {plen_, mlen_}}] := {x0, Row[{label, "s"}, "\[ThinSpace]"], {plen, mlen}}; between the two existing ones. – Tanner Legvold Nov 19 '20 at 01:38