I have the following:
Graphics[
  {
   EdgeForm[Opacity[0.5]],
   Opacity[0.75],
   ColorData[24, 6],
   Disk[{1, 0.5}, {1, 0.5}]
  },
  Frame -> True,
  PlotRangePadding -> 0.5,
  ImagePadding -> 30
 ]
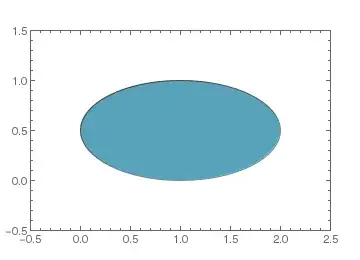
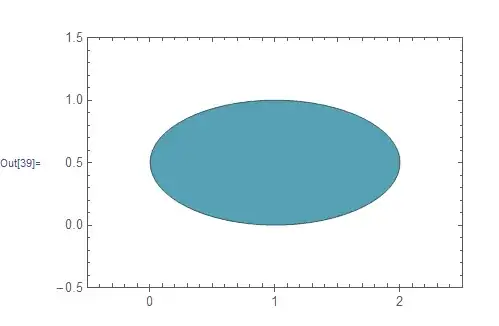
I want to change the tick labels so that they occur only at whole-number values, and have no fractional part (i.e. 0, 1, 2,... rather than 0.0, 1.0, 2.0).
I want to keep everything else, including the tick marks, exactly as it is now.
Is there a way to do this that does not require me to build the unlabeled tick marks1 from scratch?
1 The "unlabeled tick marks" would be: 1) all the minor ticks; 2) all the major ticks on the top and right edges of the frame; 3) the major ticks at (-0.5, 0.5) on the left edge, and at (0.5, -0.5) and (1.5, -0.5) on the bottom edge.
AbsoluteOptionsorFullGraphics, but those functions have never worked properly and have become more broken with each new version of Mathematica. – Simon Rochester Jun 29 '15 at 05:10